
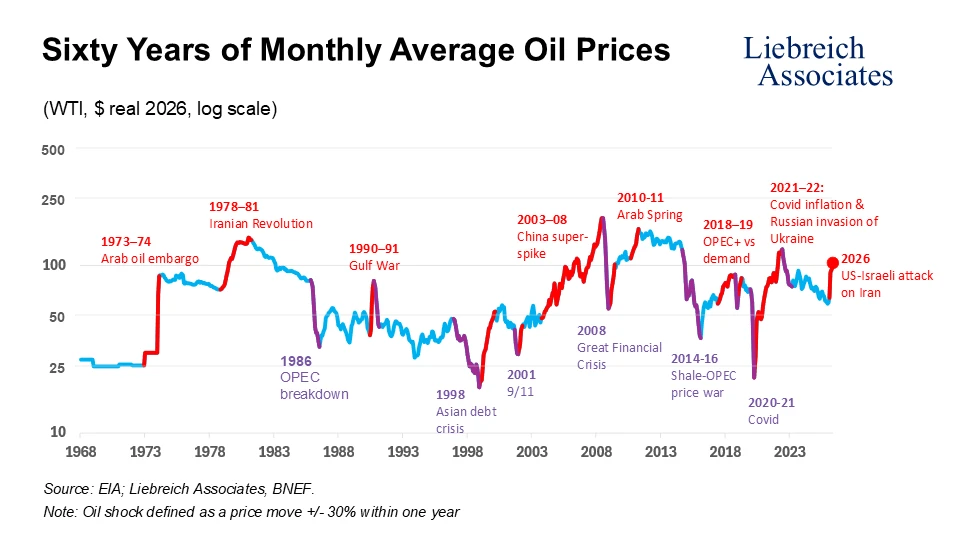
It’s not often that it is so easy to see into the future. This has certainly been the case when it comes to predicting the price of fossil fuels.
As recent events have made clear (it doesn’t even matter when this was written because it will always be true), the price of a barrel of oil swings wildly and the global supply chain is extremely unpredictable, tied to the whims of states and rogue actors.
Ancient sunlight vs. today’s sunlight: which is more affordable?
If you’re anything like us, when you see this chart you immediately think of solar power. As Bill McKibben and others have rightly pointed out recently, the energy of the sun doesn’t have to pass through the Strait of Hormuz. But to be fair, it does need to pass through some photovoltaic materials, into wires, inverters, batteries, and potentially across a vast transmission and distribution grid—and those steps cost money.
If we want to compare the price of oil with the price of solar power for useful work, we can’t just draw a flat line at zero across the bottom of the chart and declare that the sun is free everywhere. Using the sun to bring power when and where you need it costs money. We have to make an apples-to-apples comparison. When we do, we find that something amazing it happening.
By adding the cost of the solar photovoltaic modules that are needed to convert sunlight into electricity, the inversion and transmission of that electricity, and the energy storage to make it dispatchable—and by factoring in the efficiency gains of electric motors that provide useful work¹ - we can see the price for the solar version of power where and when you need it. Call it the barrel of oil equivalent for dispatchable solar. We’re comparing pump vs. plug with the same units of measurement.
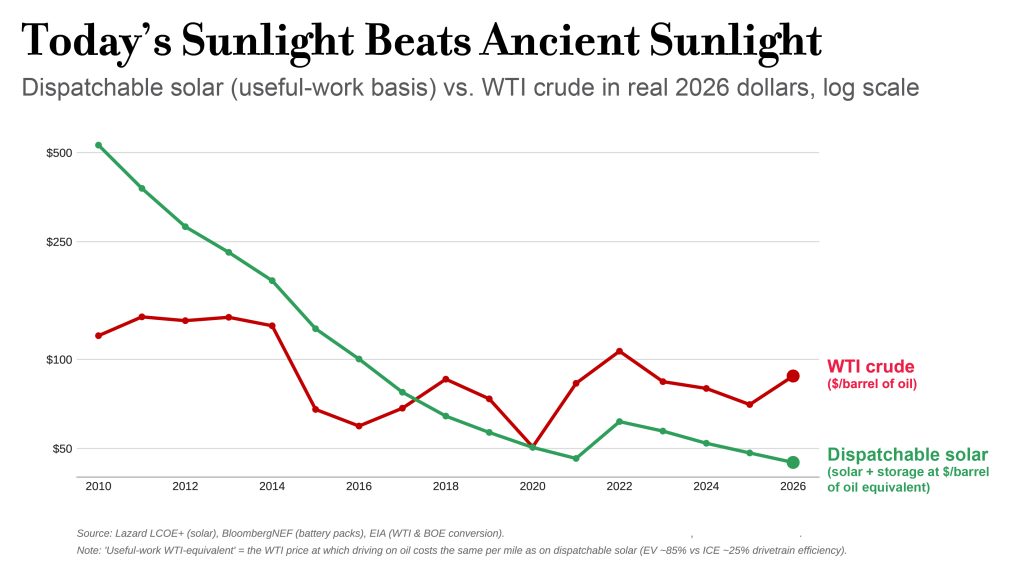
Make that comparison, and you can see that the cost of solar does not swing wildly up and down like oil, although it did see a spike during the COVID 19 lockdowns. It used to be consistently more expensive to bring solar power to where it’s needed (like to move a car forward), but only recently has dispatchable solar consistently undercut the cost of useful energy from oil. The falling cost of batteries is a big part of what made it possible. During the world’s post-COVID inflationary surge, the cost of solar and storage components rose - but so did oil. Today oil is the more expensive source on the fundamentals of technology and scale.²
This makes it very easy to see into the future.
The long-run trajectory for solar and storage points down, while oil faces mounting structural pressure upward. The cheapest, highest-quality reserves have largely been tapped, and rising geopolitical instability is delivering ever more frequent shocks to the market. It is increasingly hard to see how a barrel of oil stays consistently below about $50 - and below roughly $65, the price the Dallas Fed’s surveyed producers say they need to justify drilling a new shale well, U.S. shale growth stalls. (Existing wells keep pumping down to around $40, but without fresh drilling, output falls fast.)
The place where the direct energy comparison can most easily be made is with the cost of vehicle miles in transportation.
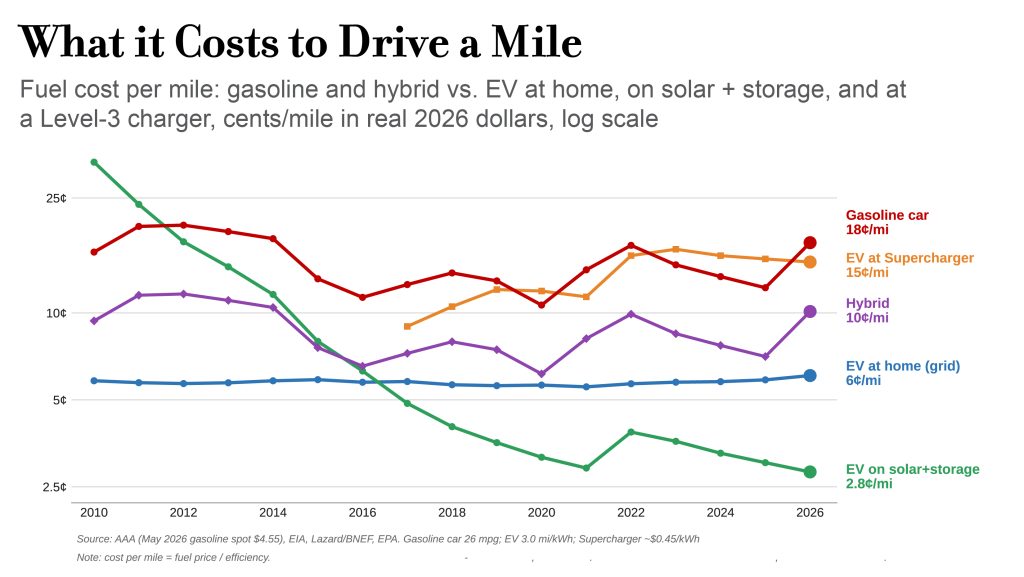
It has been cheaper to charge a car at home on retail electricity³ than to fuel it with gasoline for over a decade. What’s new is that, for a growing number of models, the sticker price of an EV now matches or undercuts a comparable gasoline car.
What is truly new is how radically cheaper it is to get around if you have your own solar panels and a battery to charge from. You’ll spot that same green solar-plus-storage curve in the cost-per-mile chart, far below everything else. As more solar and storage join the grid, the other two options - public fast charging and home charging - should keep drifting down relative to gasoline. And as of the Iran War, gasoline is now the more expensive way to move a car down the road. We may be passing the point at which it never again can compete with home or rooftop-solar charging.
If the invisible hand of the market is what drives social change, then we can see which way the wind is blowing and the sun is shining.
It’s the last gasp of gas for power generation.
As we’re beginning to see, based just on the basis of a price-driven market, we will inevitably transition away from fossil fuels. It would be nice if we’d had the vision to do this sooner through stronger industrial policy, but apparently we needed to let the market decide whether we have a planet we can live on or not. It’s a bit late, and we’re flirting with some tipping points, but at least now the market signals are finally 100% clear.
So, how about using fossil fuels for power generation? The case for coal has been clear for a very long time now. Coal now costs around $175 per MWh as a method of generating electricity while even the most expensive winter solar is under $100.⁴ But what about gas? Isn’t that a bridge fuel?
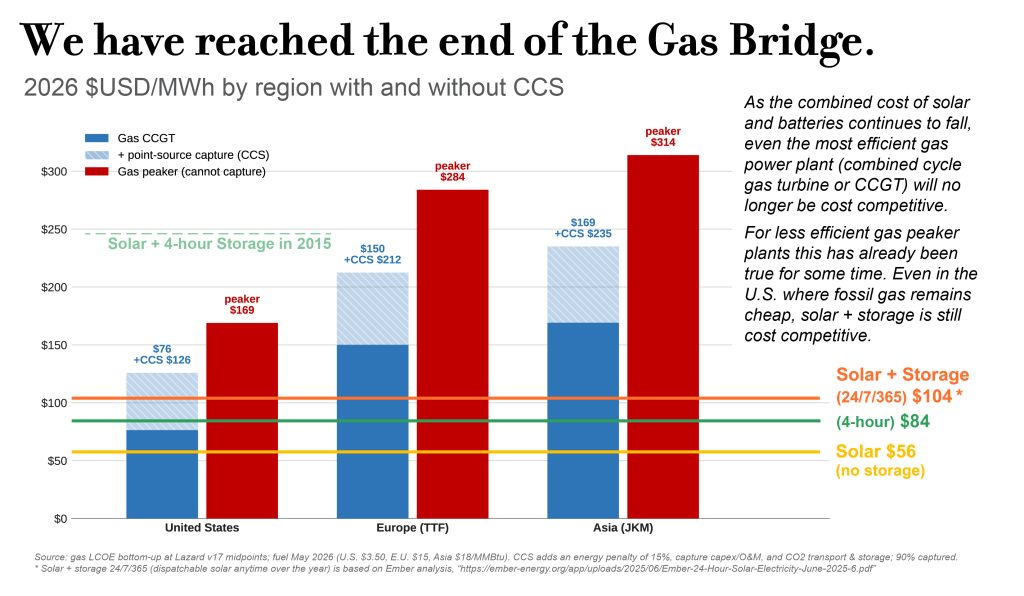
We’ve reached the end of the bridge and anyone telling you there is a future for gas to make electricity is selling you a bridge.
There are only a few narrow conditions under which it still makes sense to build a new gas power plant:
- It has to be in the United States, where gas is still relatively inexpensive thanks to shale and hydraulic fracturing.
- It has to be the most efficient combined-cycle technology (CCGT), not a peaker.
- It has to run at a very high capacity factor - basically all the time.
- And it has to face no price on its carbon pollution.
If you are anywhere other than the U.S., or if you are not running the most efficient turbines at a high capacity factor, or if a price is placed on CO₂ or you are required to attach a CCS system (which everyone should be at this point in the climate crisis) - if any one of those things are true then new fossil gas makes no economic sense. You will be better off with solar (and/or wind) and battery storage. Gas may still be cheap in the U.S. today, but there is little structural room for it to fall further - especially as the country ties its domestic prices to higher global markets through rising LNG exports. Solar + storage, meanwhile, keeps trending down.
Add to all of this that the backlog to purchase a gas turbine is now running through 2030. By then the economics of gas vs. solar will be even more in solar’s favor, so placing that order with GE today is a risky bet.
The idea of a 24/7 solar line is inspired by the excellent June 2025 report from Ember, which finds that cheap batteries can now carry solar “as close as 97% of the way” to round-the-clock supply in the sunniest places. That is the cost of pushing solar-plus-batteries alone almost all the way to constant supply - the hardest and most storage-heavy path. It acts as a useful upper bound but no real grid requires that. Actual grids draw on a mix - solar, wind, hydro, nuclear, geothermal, and several kinds of storage - so the true cost of firm, round-the-clock clean power sits between the yellow line and the orange line. The 4-hour figure represents the important job batteries are already doing of replacing gas peakers. Across markets as diverse as California and Queensland, it is clear that batteries can successfully take the place of gas for meeting the peak demand when the sun is no longer shining.
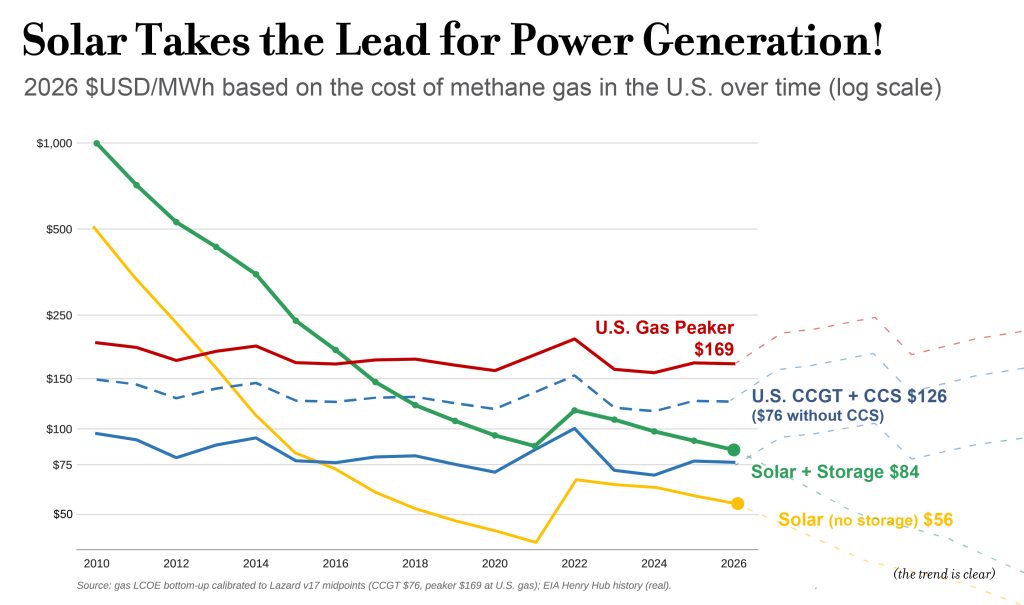
Looking more closely at the U.S. - the only place a real contest between gas and solar still exists - you can see how solar + storage has fallen since 2010, overtaking gas peakers around 2016 and drawing even with the cheapest gas option today. It edges just above bare combined-cycle gas on raw cost, and moves clearly below it the moment any price is placed on carbon. Both solar and storage are still working down their cost curves (the modest 2022–24 uptick from supply-chain and financing pressures notwithstanding). The days are numbered for gas as a feedstock for electricity generation, on free-market forces alone.
And it’s a very good thing that the economics of gas are no longer favorable over dispatchable solar + storage because fossil gas (aka “natural” gas) is extremely harmful to the Earth’s climate. In terms of emissions, we can’t forget that there are two primary ways that gas contributes to the greenhouse effect:
- It releases CO2 when it is burned. It is about 43% less CO2 compared to coal and it’s why for so long people thought that shifting from coal to gas was a great climate accomplishment. They were wrong.
- Because it also leaks methane directly into the atmosphere at the wellhead, through pipelines, during conversion to LNG if it is exported, at the receiving port if imported, and in the machinery of the power plant before it gets burned. This CH4 emission problem has only recently come to be understood as a significant greenhouse gas contributor on its own and it basically undoes all the good that gas does as a cleaner burning fuel than coal. In a very leak-prone system it may even be worse to use gas than coal. There are a lot of nuances to this, but you can read more in this study, which finds that, “a gas system leakage rate as low as 0.2% is on par with coal.”
Electric heat pumps put gas on ice.
So it’s official. 2026 marks the death of the “green premium.” From now on there is a “gray premium” on building new fossil fuel infrastructure, because in nearly every case the clean version is now cheaper. The era of affordable dispatchable renewables has arrived — variable renewables paired with enough batteries and long-term storage to meet electricity demand 24/7/365 for less than fossil fuels can.
But what about space heating? We still need our gas furnaces right? Don’t tell me solar is cheaper for heating too?!
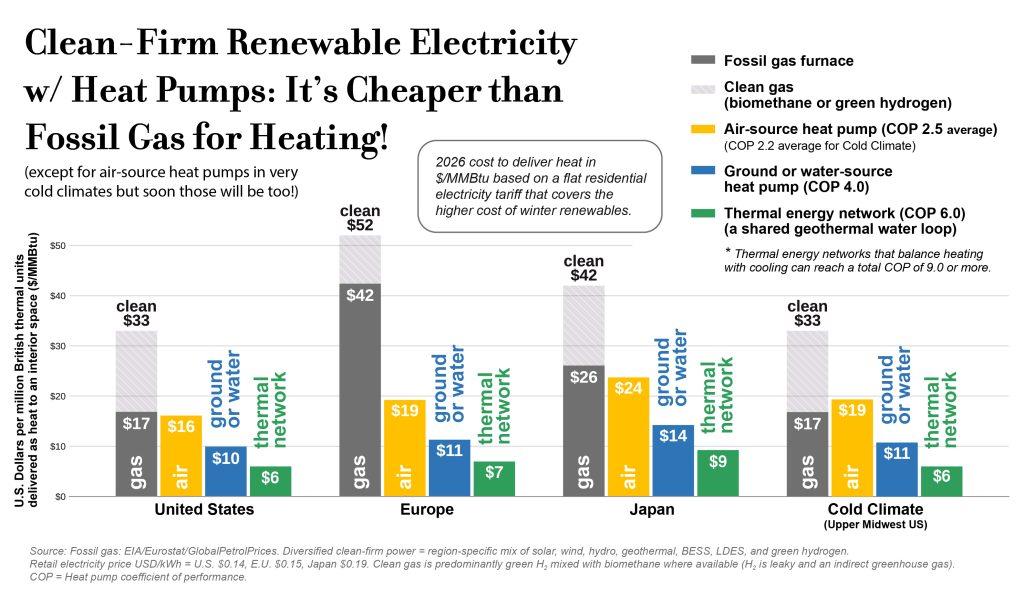
To make our space-heating comparison, we use U.S. dollars per MMBtu (one million British thermal units delivered to an interior space) and ask which is cheaper: producing those MMBtus of heat by burning fossil gas, or by using clean electricity to run a heat pump. That heat can come from an air-source, ground-source, or water-source heat pump, or from a thermal energy network - and each has its own coefficient of performance (COP). The higher the COP, the less electricity the system uses per MMBtu of delivered heat. An air-source heat pump typically has a COP of 2.0–3.0, a ground-source or water-source heat pump around 4.0, and a thermal energy network as high as 9.0—though we use a conservative 6.0 in the chart.
COP is one of the two key variables behind the chart. The other is the cost of the clean-firm electricity needed to run heat pumps reliably through the dark of winter. Running a heat pump on grid electricity that still includes some gas or coal is already better for the climate (and your health) than burning gas in your home - but running it on 100% renewables is even better still.
We can’t simply use the very low cost of solar power on its own, because the times we most need heating are exactly when solar contributes least to the grid (this is a Northern Hemisphere study). Instead, we have to use the real cost of delivering clean-firm electricity 24/7/365—a mix of solar, wind, hydro, geothermal, battery storage, and longer-duration storage such as iron-air batteries and green hydrogen. A realistic figure is $91/MWh ($0.091/kWh). By comparison, solar or wind on its own runs about $38/MWh ($0.038/kWh), and paired with four-hour lithium battery storage about $50/MWh ($0.05/kWh); it’s the long-duration storage that brings the price up. Add a reasonable set of transmission and distribution fees, and we arrive at a retail price of electricity of roughly $0.14/kWh in the U.S., $0.15 in the E.U., and $0.19 in Japan.
You may have heard of low-carbon gas alternatives such as biomethane and green hydrogen for space heating. The chart shows how expensive that decarbonization pathway would be: green hydrogen takes a great deal of energy to make, and the supply of biomethane is limited.
The only place a fossil gas furnace still wins is in a very cold climate—like the American Upper Midwest—where an air-source heat pump runs at a lower COP. But the higher COP of ground-source and water-source heat pumps, and of thermal energy networks, means that even in those extreme-cold locations it already makes sense to switch from gas to one of those systems. And as air-source efficiency keeps improving, it won’t be long before gas has lost its last advantage anywhere. Remember, too, that a furnace can’t provide air conditioning in summer the way an air-source heat pump can&mdashand many places with extreme cold also have hot summers. To keep the comparison apples-to-apples, this study doesn’t even count the value of summer cooling.
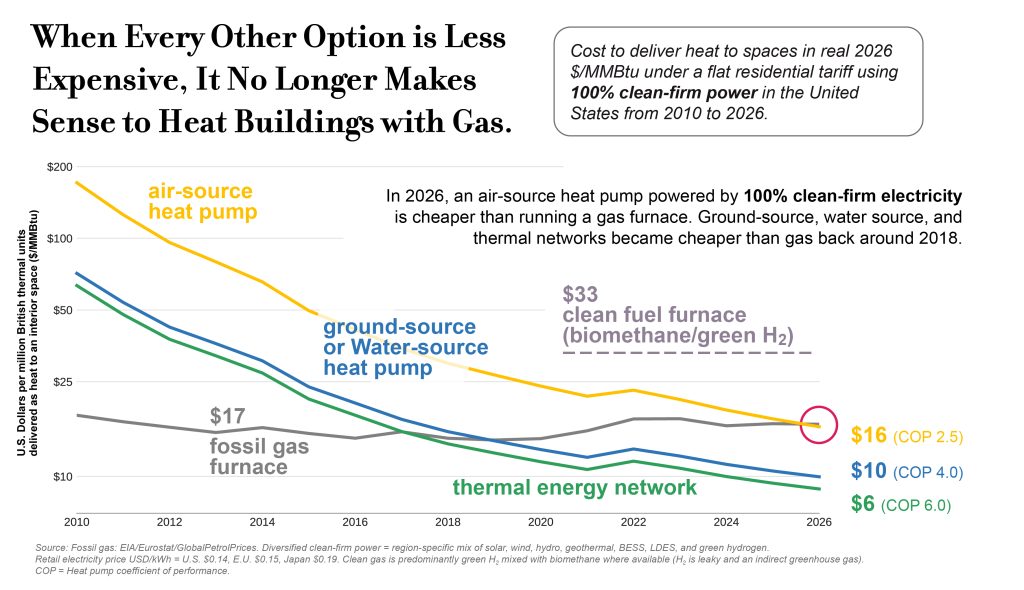
The second chart takes a closer look at the United States alone (the left-hand group in the first chart). It shows that heat pumps powered by 100% renewables weren’t always the cheapest way to heat a home. Back in 2010, delivering 24/7/365 clean electricity cost far more, and heat-pump COPs were not as high as they are today.
As battery costs have fallen and COPs have risen, we’ve now reached the crossover, in 2026, where—even with the low price of fossil gas in the U.S., where hydraulic fracturing has opened up supply—it is still cheaper to heat your home with an air-source heat pump running on 100% clean-firm electricity.
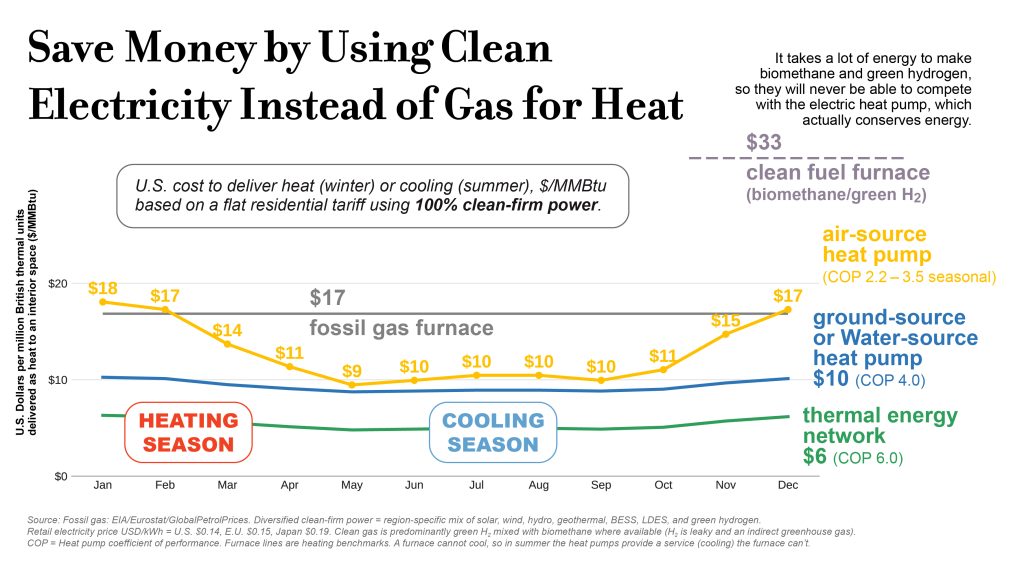
This study compares the cost of heat alone, but the chart points to another advantage shared by all heat pumps: they can run in reverse in summer to provide central air conditioning. For thermal energy networks and ground- and water-source heat pumps, there’s no contest. They cost more to install up front but are clearly cheaper to operate than a gas furnace all year round. With an air-source heat pump you’ll pay a little more in the very coldest U.S. months (because gas there is so cheap), but you come out ahead over the heating season as a whole and you get relatively inexpensive cooling from the same system all summer.
Stay tuned for the next three-part series, comparing fossil fuels to dispatchable renewables for diesel equipment, flight, and industrial manufacturing. In the meantime, let’s celebrate the fact that clean energy is now cheaper than fossil fuel for nearly all of our useful energy needs—great news for the climate, for habitats, and for clean air and water.
Notes:
¹ What ultimately matters is the useful work done - moving a car, heating a room, driving an industrial process. A conventional gasoline car turns only about 12–30% of the energy in its fuel into motion; the rest is lost mostly as heat. An electric vehicle delivers roughly 87–91% of the electricity it draws to the wheels (U.S. DOE/EPA, fueleconomy.gov). That is three to four times more useful work per unit of energy.
² In the future, when solar modules are no longer manufactured inside an expensive, fossil-fueled economy but are instead built using the sunlight they themselves harvest, solar should take another step down its cost curve. Decoupling solar production from fossil-fuel prices would put it on a decline that can no longer be nudged upward by the geopolitical energy shocks that drive global inflation.
³ You might be wondering why the line is flat while electricity prices have gone up since 2010. The residential electricity prices are EIA national-average residential rates: 11.5¢/kWh in 2010 rising to 18.2¢/kWh in 2026 nominal dollars - a 58% increase. The chart is denominated in real 2026 dollars, and over that same span CPI rose 51%. Almost the entire nominal increase is due to inflation. In constant 2026 dollars, residential electricity went from 17.5¢/kWh (2010) to 18.2¢ (2026) - about +4% over sixteen years. Divided by 3.0 mi/kWh, that’s why the blue line sits at 5.8¢/mi throughout and only ticks up to 6.1¢ at the end.
⁴ Not to mention the copious quantities of pollution it dumps into the air we breath and into the thin atmosphere that has been finely-tuned by natural systems to perfectly regulate the Earth’s climate over millions of years.
Sources: EIA, Lazard, BNEF,