
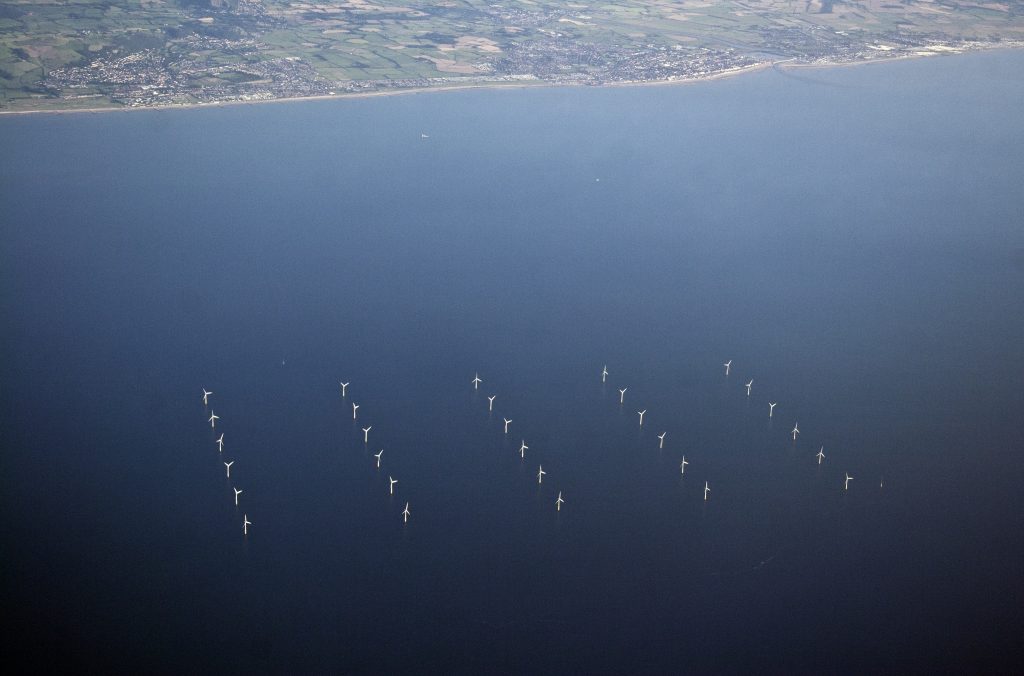
As we continue to draw down carbon rapidly this decade, one of the most important tools in the toolkit of the energy transition is offshore wind. It’s powerful, provides energy to the grid both day and night, and when situated far enough from the shoreline it is nearly invisible.
For a more updated and comprehensive look at land and ocean areas required for a 100% renewable energy world, see the latest update from LAGI here: LAND AND OCEAN AREAS TO SUPPORT A 100% RENEWABLE ENERGY, ZERO-EMISSIONS, REGENERATIVE GLOBAL ECONOMY
Europe is by far the world leader in offshore wind and the European Union is planning a 25-fold increase in capacity in the next five years. Denmark has been leading the way, beginning with its first offshore wind farm, Vindeby, in 1991.
Offshore the winds are stronger and more constant but the engineering and maintenance challenges can be greater. For now they must be installed in the relatively shallow waters of continental shelves, but floating offshore turbines are not so far off.
After a long hard road of false starts and regulatory uncertainty, the United States is finally about to break through with a surge in offshore wind capacity this decade, following the success of a few recent projects, like the Principle Power Windfloat. The potential power available in leases off the shores of the US could meet a large percentage of the nation’s energy demand with zero carbon emissions. There is massive economic development potential to building out the supply chains for this emerging industry in North America.
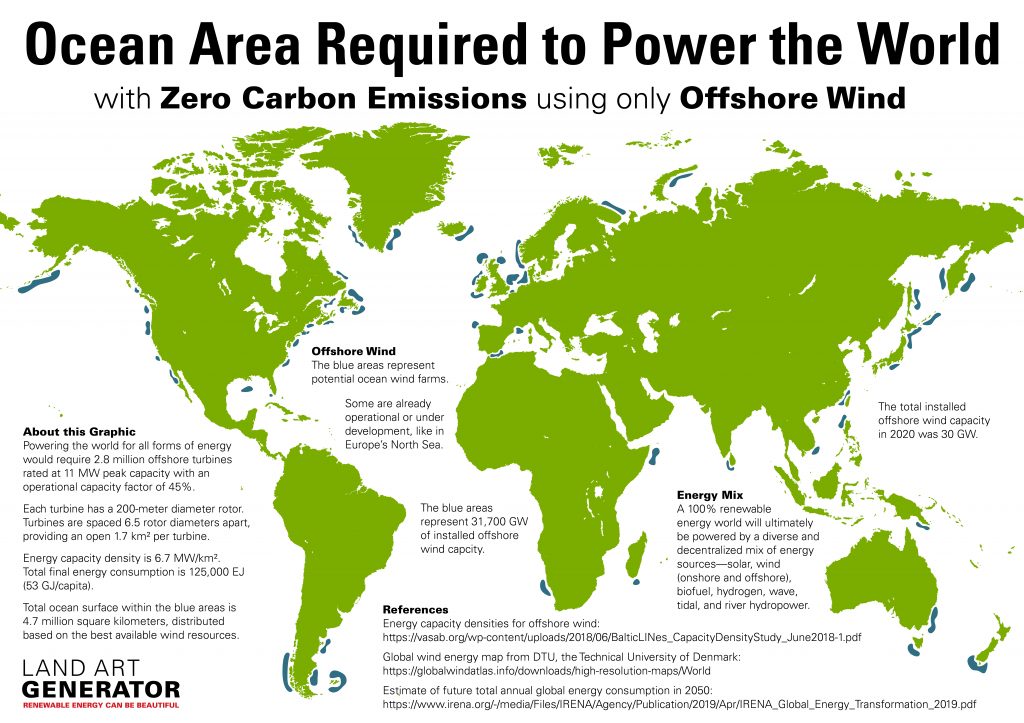
This information graphic shows the ocean area that would be required to meet the entire world’s energy consumption in all forms (electricity, heating, transportation, etc.). Of course a global economy powered by 100% clean energy will include a broad mix of technologies including solar, hydroelectric, geothermal, onshore wind, biofuels, wave, and tidal energy, with offshore wind only accounting for around 12%. So when you look at this map, consider that the actual areas we will need by 2050 for offshore wind will be less by about a factor of 8.
The implementation of offshore wind has a relatively light footprint. Fishing and other activities can take place in the surrounding waters, and the pylons if installed properly can provide habitat for fish and other wildlife. Click here to see the numbers behind the visualization. The areas include the space between turbines and are based on the area density of existing offshore wind projects.
If you’d like to learn more about the future of offshore wind in America, we recommend listening to Jason Jacobs’ interview with David Hardy, CEO of Offshore North America at Ørsted, on the podcast My Climate Journey.
References
Energy capacity densities for offshore wind
https://vasab.org/wp-content/uploads/2018/06/BalticLINes_CapacityDensityStudy_June2018-1.pdf
https://on.ny.gov/2RWX48T
Global wind energy map from DTU, the Technical University of Denmark
https://globalwindatlas.info/downloads/high-resolution-maps/World
Estimate of future total annual global energy consumption in 2050
IRENA_Global_Energy_Transformation_2019.pdf
[…] Powering the world with offshore wind, 23.11.2020 (линк); […]
[…] worked out the optimal locations for these imaginary installations, using some of the same data as Land Art Generator, a public arts initiative. Locations are scattered around the globe. Some dot […]
[…] worked out the optimal locations for these imaginary installations, using some of the same data as Land Art Generator, a public arts initiative. Locations are scattered around the globe. Some dot […]