
 “Land & Ocean Areas to Support a 100% Renewable, Zero-emissions, Regenerative Global Economy” by the Land Art Generator Initiative. Licensed under Creative Commons CC BY-NC-ND.
Click on image for access to the full-resolution PDF.
Summary
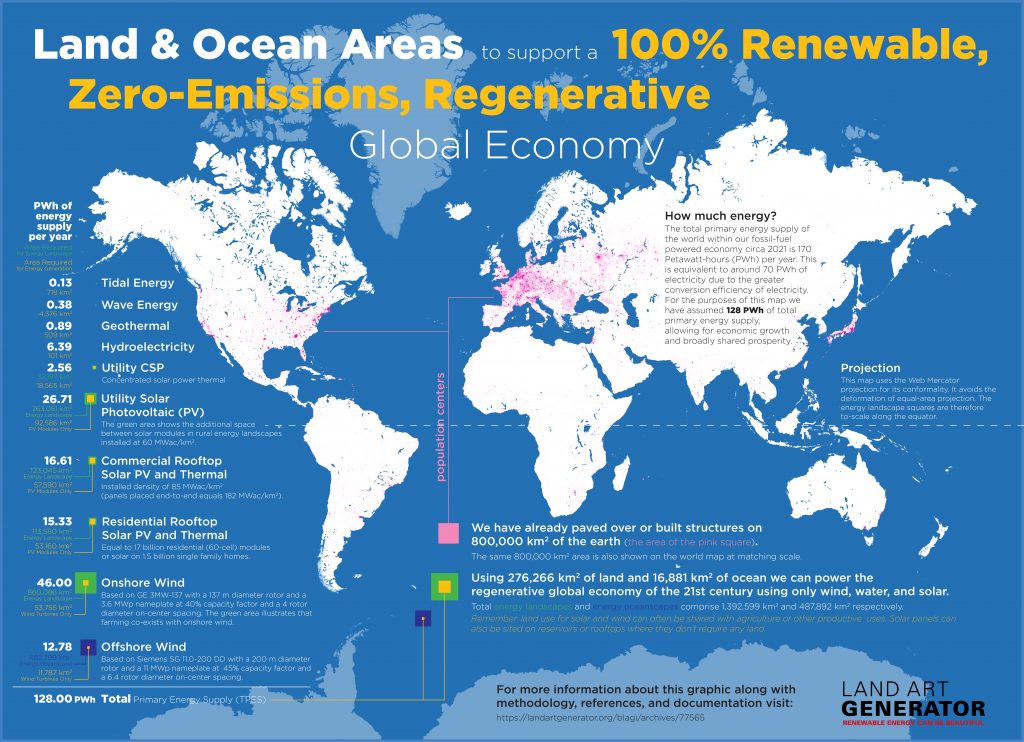
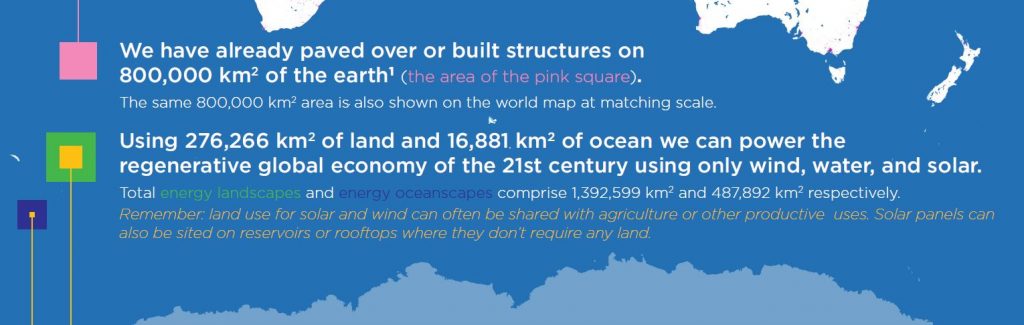
- To meet the target of net-zero by 2050 we will need to deploy 1.4 million square kilometers of renewable energy landscapes and 488 thousand square kilometers of renewable energy oceanscapes.
- More than 80% of this area will consist of “the space between”—the grassland between rows of solar panels and the fields or stretches of ocean between wind turbines.
- At least another 8% will consist of rooftop installations that do not take up ground space.
- That leaves 166,000 km2 of land area that will be devoted exclusively to renewable energy technologies in a 100% renewable energy scenario assuming that the global economy continues to consume energy at a consistent pace.
- While the land use impacts of the energy transition are significant, design innovation for shared land uses with clean energy generation and a focus on maximizing distributed energy resources can help accelerate the shift to a net-zero economy and ease the burden on rural landscapes.
What does a 100% renewable energy world look like?
OK! We know we have to kick our carbon emissions. But how exactly? And what are the social and environmental consequences that flow from the solutions? How much of our land must we convert to solar arrays and wind farms? There are many roadmaps for how to get to net-zero by 2050 (e.g. this, this, this, and this). Most of these roadmaps include a pathway that relies on 100% renewable energy—and with good reason, since the suite of technologies in the renewable energy portfolio are the most ready for prime time when it comes to zero-emissions energy. Let’s face it, nuclear and carbon capture are not looking so hot right now. That’s not to say that we won’t have a breakthrough, and there is a lot we can do to eliminate GHG emissions from farming and other human activities.
Still, the question remains. If we replace all of the energy the entire world generates and consumes with 100% renewable energy—all electricity made from solar, wind, and water; electric cars, trucks, and ships; heat pumps instead of gas boilers, electrify everything including construction equipment; green hydrogen and ammonia for heavy industry—just how much land will we need to cover with solar panels and how many landscapes will remain where wind turbines do not adorn the horizon? We say adorn because we have nothing against the aesthetic of solar and wind energy landscapes. But some people do. And some of the same people have a lot against high voltage transmission lines, another important part of the net-zero equation. Especially if we go down the path of outsourcing the majority of our energy generation to rural areas (keeping the old centralized model), we’re going to need more and better interconnected transmission and distribution infrastructure.
With all of this in mind, and by popular demand, we decided to update our wildly popular 2009 information graphic, The Total Surface Area Required to Fuel the World with Solar. This is a part of our ongoing information graphic series that both helps to dispel myths about the energy transition, while also highlighting some hard truths.
It remains true that the energy density of renewable energy technologies like solar and wind is low in comparison to condensed fuels like oil. That’s not to say that the land use impacts of fossil fuel extraction, refinement, distribution, and combustion are insignificant. And you can see in our infographic on coal vs. solar that 312 km2 of solar can generate more electricity than the coal that came from the 516 km2 of mountaintops that were bombed out to get to it.
Still, we need to be honest about how much land we really need to transition to a net-zero future because we have to make the cultural case. In order for these technologies to be deployed at the scale we need them to be deployed, they have to first become universally popular and welcomed. Developers will be seeking approvals for permits on millions of projects and will need to consult on a neighborhood-by-neighborhood and county-by-county basis with the people who live and work next to these future energy landscapes.
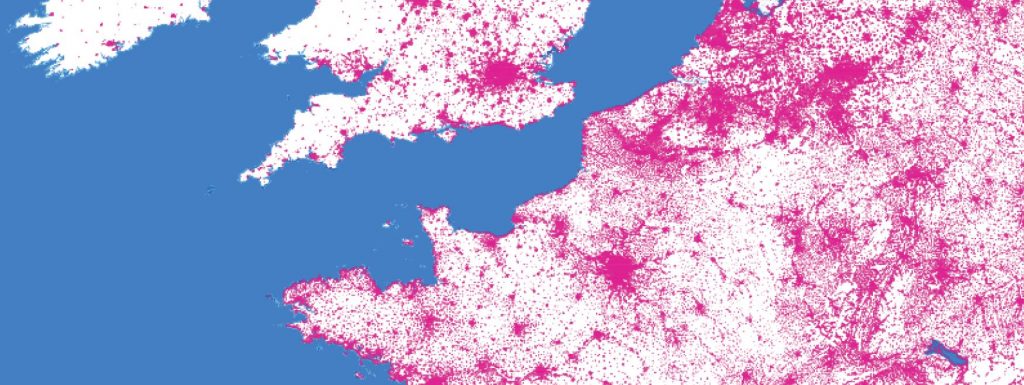
This latest information graphic from LAGI shows the built-up area of the world in pink (in the full-resolution PDF version you can zoom in on every city). These are the parts of the planet we’ve already paved over or built structures on. That 800,000 km2 is also shown aggregated in the large pink square so you can see it all in one place.
If we were to get rid of fossil fuels entirely—no methane gas, no petroleum oil, no coal, no diesel—and if we were to power our economy entirely with renewable energy at the scale of consumption we have today and for 8.5 billion people, we could do so in less land area than we have already paved or built upon. Energy consumption in these population centers is the highest and so it makes sense to generate as much energy there as possible. But these areas are also where land is most valuable, and there are many cherished cultural spaces even the most techno-utopian solar punk advocate wouldn’t want to paper over with solar panels no matter how pretty they might be.
We can’t build huge canopies of solar over all of our cities. We must centralize some amount of energy generation in remote landscapes with utility-scale wind farms and solar arrays. But there is a limit to how much rural land we can permit for these installations. Energy developments in rural areas often come up against a politically-diverse opposition, citing visual beauty, heritage, culture, habitat preservation, conflicts with agriculture, or real estate. And the high voltage transmission lines required to bring that energy to cities are often more difficult to permit than the solar and wind arrays themselves.
What’s the verdict?
This latest LAGI information graphic shows that a 100% renewable energy world is possible. It also shows that the pressures on land use are not trivial. The scale of what we must accomplish in the next few decades is enormous. By 2050 we will need to have deployed 1.4 million square kilometers of renewable energy landscapes and 488 thousand square kilometers of renewable energy oceanscapes. Of that land area, More than 80% will consist of “the space between”—the grassland between rows of solar panels and the fields or stretches of ocean between wind turbines. At least another 8% will consist of rooftop installations that do not take up ground space. That leaves 166,000 km2 of land area that will be devoted exclusively to renewable energy technologies in a 100% renewable energy scenario assuming that the global economy continues to consume energy at a consistent pace.
In our 2009 information graphic, we only looked at the hypothetical scenario of how much surface area of solar alone that it would take to power the world. In this version we have looked at the energy landscapes (and oceanscapes) of ten renewable energy technologies. In 2009 we only looked at the surface area of the solar modules themselves, not the space between the modules that is necessary for operational maintenance, safety, and to avoid shadowing. In this version we look at more than just the area of the technology itself (yellow squares), but also at the energy landscapes and oceanscapes that will, for the most part, be required to serve a support role (green and dark blue areas).
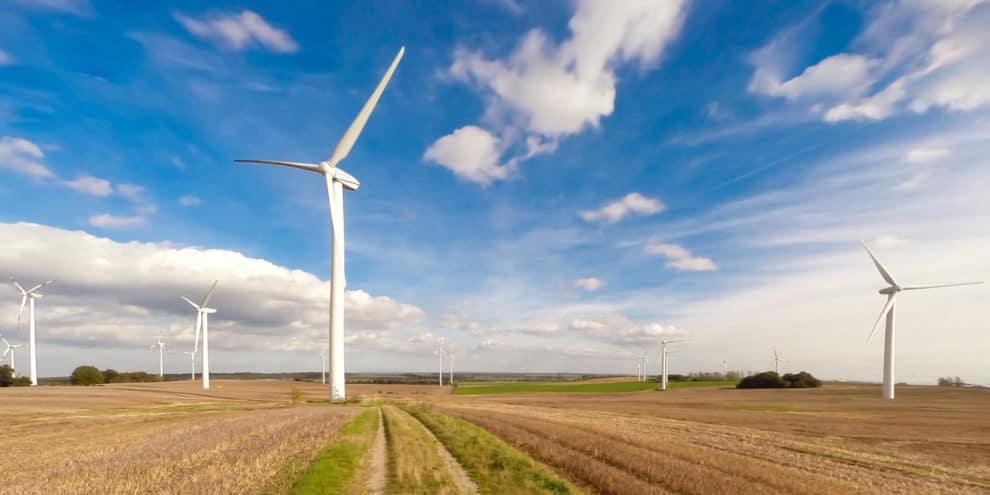
That is not to say that the spaces between the panels and the turbines can’t be useful for other purposes. In fact they can bring many co-benefits. When looking at the onshore wind turbine “landscape” area it is especially important to remember that wind turbines have already proven themselves to be a perfect match for agriculture, both croplands and pasture. According to OECD statistics, humans are already globally stewarding 15.7 million km2 for permanent cropland and 32.3 million km2 for pasture. Together that is 48 million km2 of land we are already maintaining. If we devote just 1.8% of the windiest areas of these agricultural landscapes to shared use with wind energy then we can meet the 860,000 km2 required for onshore wind energy landscapes.
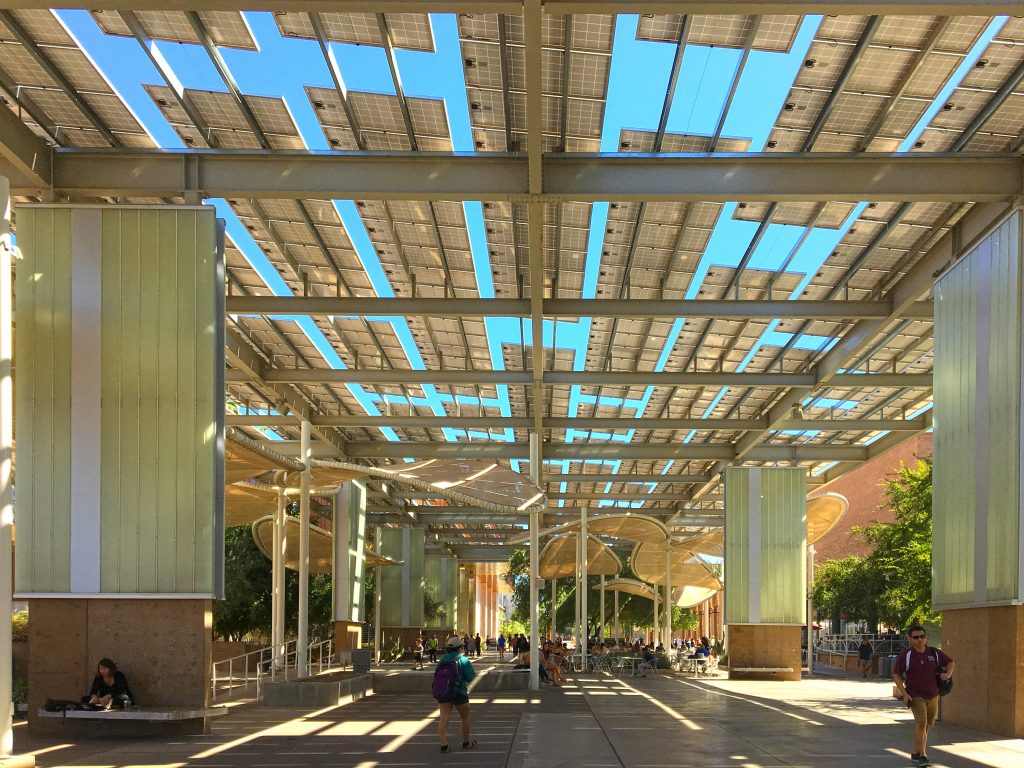
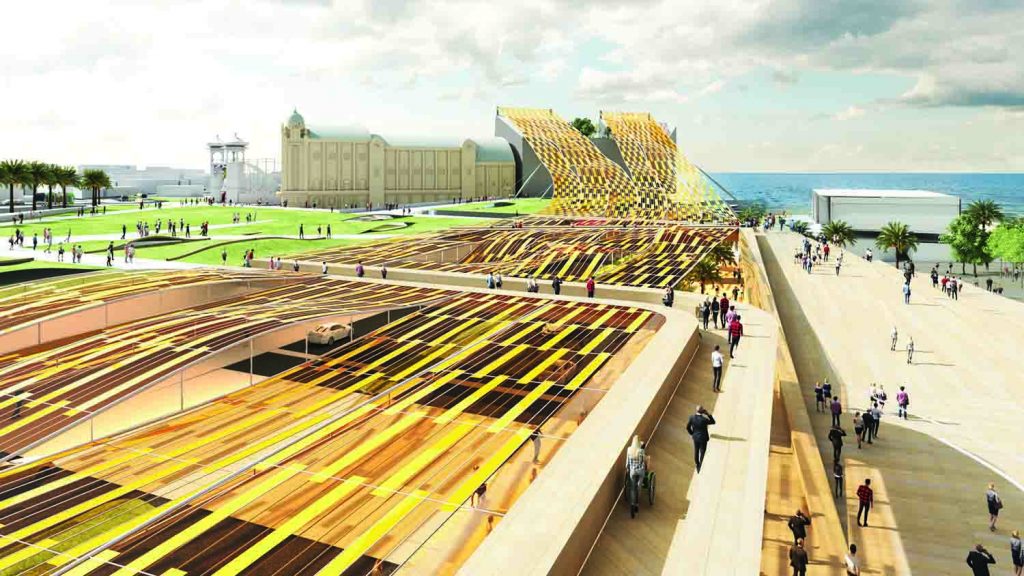
In terms of solar energy landscapes, there is good news there as well. There are many ways to share land use with solar energy generation and weave it into our already-designed landscapes, including pastoral and cropland agriculture (agrivoltaics), reservoirs and lakes (floatovoltaics), landfills, water treatment sites, large public gathering spaces, recreation facilities, parking lots (who doesn’t like a shaded and dry parking lot?), highway corridors (there are 94,000 km2 of highway in the United States alone) and highway cap parks, neighborhood parks, riverfronts, open air markets, and there is a lot we can do with building integrated photovoltaics.
For lighter urban densities without tall buildings, it is possible to take full advantage of opportunities to fuse energy landscapes with urban planning, community co-design—building solar into every suitable project and generating an amount of energy within the city boundary equivalent to that consumed by its citizens, businesses, and visitors.
For more on how we can expand solar projects in cities by aggregating projects, focusing on equitable human co-benefits, and co-designing directly with communities and city planners, see our Build Back Solar document.
Methodology
To generate this updated energy land use graphic we first established the amount of energy the world needs to generate, converting it to petawatt-hours (one billion megawatt-hours). After comparing estimates from BP, the IEA, the EIA, and IRENA, we came up with what we think is a reasonable amount of energy to generate and meet the needs of a growing population with reasonable expectations for an ever-improving standard of living. 128 Petawatt-hours of 100% renewable energy—in the form of an interconnected electricity grid with sufficient transmission and storage, along with a mix of zero-emissions portable fuels like hydrogen and biofuel—will be enough to lift the average energy consumption of the entire world of 8.5 billion people to that of Europe today.
Based on a portfolio mix of ten technologies that we know are renewable, have proven reliable, and can be designed without substantial negative environmental impacts (any new hydro should be run-of-the-river hydro for example), we then established the land use requirements of each to produce its share. This was calculated in two ways. One to show the actual physical cover of the technology. The other to show what an energy landscape using that technology might look like, including the spaces between the technology.
We studied boundary areas of a number of solar arrays around the world. We took the high range as the standard (60 MWac/km2), knowing that greater density is possible for utility-scale installations. In places where the cost of land is not exceptional, the density of layout may not always be the most important factor in design. Policy could therefore increase the density required of centralized solar installations.
We did not take into account the land use requirements of energy storage under the assumption that the amount of storage required to meet peak demand during periods of low generation capacity will be able to share land use with solar energy landscapes. Often the boundary area drawn around the perimeter of utility solar installations included a battery container. For simplicity and also due to a lack of confirmable data, we also did not take into account the mining activities related to extracting raw resources to manufacture renewable energy technologies. Our hope is that we can quickly shift to a circular economic model of recycling and material reuse that will relieve pressure on mining activity. Recent advancements in battery technology are also pointing the way to more sustainable energy storage systems.
For a look at the numbers behind this infographic, you can download the Excel file (ctrl-click, save link as).
References
How much energy do we need to generate carbon-free to maintain and increase standards of living?
- https://www.bp.com/en/global/corporate/energy-economics/statistical-review-of-world-energy.html
- https://www.iea.org/data-and-statistics/data-tables?country=WORLD&energy=Balances&year=2018
- https://www.iea.org/reports/key-world-energy-statistics-2020/final-consumption
- https://irena.org/-/media/Files/IRENA/Agency/Publication/2019/Apr/IRENA_Global_Energy_Transformation_2019.pdf
- https://irena.org/-/media/Files/IRENA/Agency/Publication/2020/Apr/IRENA_Global_Renewables_Outlook_2020.pdf
- https://en.wikipedia.org/wiki/World_energy_supply_and_consumption
- https://carbontracker.org/reports/the-skys-the-limit-solar-wind/
- https://ourworldindata.org/energy-production-consumption
How should we generate the energy the world needs while reducing emissions rapidly to zero?
- https://thesolutionsproject.org/why-clean-energy/#/map/countries/location/ALL
- https://www.iea.org/reports/net-zero-by-2050
- https://netzeroamerica.princeton.edu/
- https://www.rewiringamerica.org/handbook
What will the population be?
- https://www.un.org/sustainabledevelopment/blog/2015/07/un-projects-world-population-to-reach-8-5-billion-by-2030-driven-by-growth-in-developing-countries/
- http://demographia.com/db-worldua.pdf
Built up areas of the world
- Florczyk, Aneta & Corbane, Christina & Ehrlich, Daniele & Freire, Sergio & Kemper, Thomas & Maffenini, Luca & Melchiorri, Michele & Pesaresi, Martino & Politis, Panagiotis & Schiavina, Marcello & Sabo, Filip & Zanchetta, Luigi. (2019). GHSL Data Package 2019. 10.2760/290498. https://www.researchgate.net/publication/334225470_GHSL_Data_Package_2019.
- Brown de Colstoun, E. C., C. Huang, P. Wang, J. C. Tilton, B. Tan, J. Phillips, S. Niemczura, P.-Y. Ling, and R. E. Wolfe. 2017. Global Man-made Impervious Surface (GMIS) Dataset From Landsat. Palisades, NY: NASA Socioeconomic Data and Applications Center (SEDAC). https://doi.org/10.7927/H4P55KKF.
- https://stats.oecd.org/Index.aspx?DataSetCode=BUILT_UP
How can we estimate wind energy density?
- https://www.msp-platform.eu/practices/capacity-densities-european-offshore-wind-farms
- https://vasab.org/wp-content/uploads/2018/06/BalticLINes_CapacityDensityStudy_June2018-1.pdf
- https://cleantechnica.com/2012/07/27/wind-turbine-net-capacity-factor-50-the-new-normal/
What Installed capacity do we already have?
- https://www.statista.com/statistics/267358/world-installed-power-capacity/
Areas of specific installations calculated using Google Earth boundaries
- https://earth.google.com
Update: Download this KML file that you can open in Google Earth or any other GIS program.

The map on this page doesn’t show the footprint of any of the renewables listed on the map. That makes it useless for convincing people. Please create a map that *shows* the renewables.
https://landartgenerator.org/blagi/archives/77565
Thanks for your comment. The squares along the left side next to each technology show the total area (aggregated footprints) that each technology would occupy at the same scale as the world map. Hope this helps.
solar energy is good trending for the world
There are already electrical energy storage devices that can store power with no losses and never wear out. Gravitic energy storage. (Gravity energy storage
Gravity batteries store gravitational potential energy by lifting a mass to a certain height using a pump, crane, or motor. After the mass is lifted, it now stores a certain gravitational potential energy based on the mass of the object and how high it was lifted.)There are batteries (Lithium Titanate) that are safe (no risk of fire or short circuit from punctures (Toshiba SCiB) and can last up to 50 years. The way to save the planet is with safe technologies that never wear out. This is what the kids at the institutes of technologies should be working on. How about some 100 million dollar prizes?
I’m unable to open that PDF on my iPhone. Do you have other versions of the PDF or perhaps just large bitmap image file versions?
[…] Webseite Landartgenerator erklärt etwa, dass man den prognostizierten Weltbedarf für das Jahr 2050 vollständig durch […]
[…] Webseite Landartgenerator erklärt etwa, dass man den prognostizierten Weltbedarf für das Jahr 2050 vollständig durch […]
Great data, it is so strange that the surface/area/volume values are not often taken into account, i seriously believe there is a need to add several items in the renewable energies calculations.
We use to utilize the efficiency, capacity factors as main items, but what about(unlimited);
Area/volume used to produce a certain amount of energy,
The resources needed to…
The lifetime,
The “remaining” elements/trash after Deinstallation
All the co² issues
All the financial issues
The perenity of the systems…
These are a few of them, it is clear that today’s numbers are incomplete are, Iseriously think we need to improve or modify our actual solutions.
Undoubtedly, from this date onwards, the world energy problem will be solved and all the economic, political and cultural infrastructures of the world will change, and soon all the countries of the world will adapt to this advanced and clean technology.
After the invention of the new method and formula of clean energy production, why do we not need wind on the beach and in the seas to produce energy?
The purpose of this invention is to produce clean and cheap energy, which is obtained by finding the correct answer to a difficult scientific question. This invention clearly proves that I was able to achieve this answer.
In disbelief, for more than one hundred and fifty years, all the scientists of the world have been searching for this scientific answer and have not succeeded. The world’s most prominent physicists, including Albert Einstein, were not interested in finding this scientific answer because they knew they did not have the scientific ability!
I found this scientific answer in 2013 and fortunately it has been finally approved by the University of Iraqi Kurdistan. Now, according to the legal documents of the German Patent Office, fortunately, a permit has been issued for the construction of this new clean energy power plant model. This means that German companies have a license to build this new power plant. The power plant that will be built for the first time in the world and has no similar example in the world.
This invention is in fact a gift to the Green Peace and the UN General Assembly, taking into account all its political, economic and cultural rights, which are reserved for me as its inventor.
Undoubtedly, from this date onwards, the world energy problem will be solved and all the economic, political and cultural infrastructures of the world will change, and soon all the countries of the world will adapt to this advanced and clean technology.
Fortunately, I now have a simple example of this power plant and I am able to show it to scientists.
This clean energy power plant includes a new deep water power plant method for dams and seas that works based on a physical formula. In other words, we produce clean energy at the zero point of the opposing forces, and we will make the most of the natural properties of air and deep water.
What is the complex global scientific question in hydroelectric knowledge?
How can we obtain clean energy in the best way from the potential of water static head in dams and seas that is very different from with the past methods?
Answer:
This is by getting benefit of joint scientific formula (E>P+1at) with immersion turbines method inside the water of dams and seas (Immersion turbines of series and parallel in zero point of opposite forces).
(Ee>Ep+E1at) = (E>P+1at)
Ee= High pressure clean energy that is produced by the water power plants in the depth of water via released fixed potential energy of water natural pressure (More than ten meters of water) with new method (Immersion turbines of series and parallel in zero point of opposite forces).
(Ee = Strong clean energy generated in the system)!
Ep= Released fixed potential energy of water natural pressure in water depth (More than ten meters of water).
E1at= Amount of energy that is consumed at a small pump of one atmosphere power is the ability (In the same place of the water power plant in water depth).