
click for larger image
download high resolution PDF
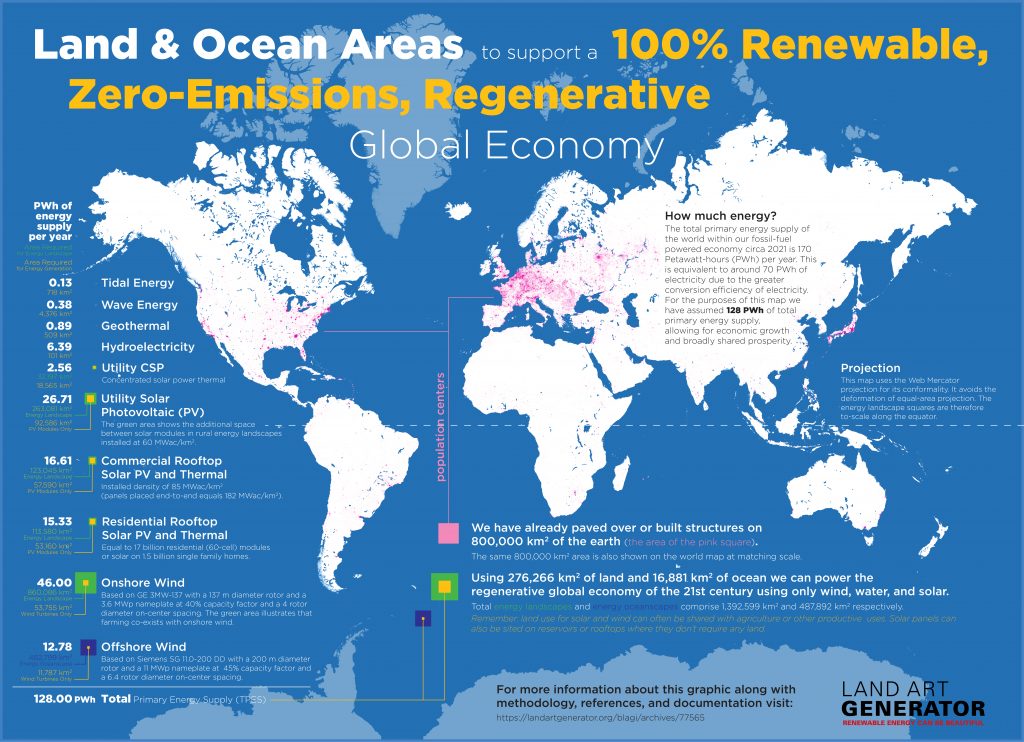
Note in 2021: We have updated this information graphic in August of 2021. Please see the new post, which provides more updated information related to the energy landscapes and energy oceanscapes required to power a 100% renewable energy world: https://landartgenerator.org/blagi/archives/77565
Note in 2015: This post is from 2009. Some of the links below may be broken. The IEA has updated estimates since 2009, but the overall trends are the same. We hope that with the implementation of demand-side efficiency measures worldwide, long-range estimates will prove to be overestimated.
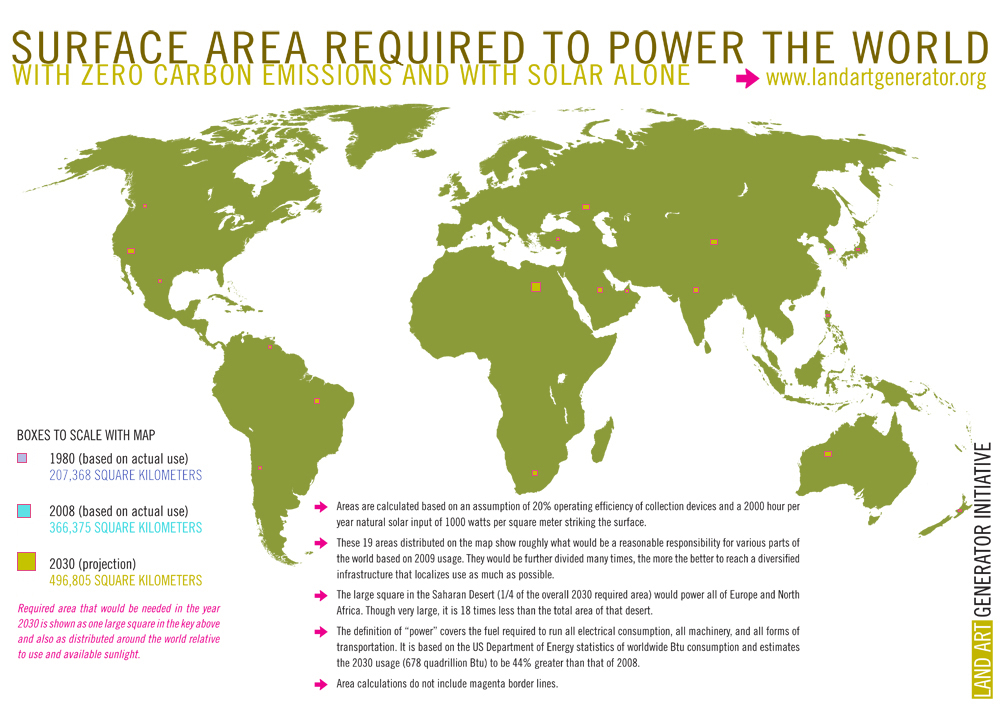
According to the US Department of Energy (Energy Information Administration), the world consumption of energy in all of its forms (barrels of petroleum, cubic meters of natural gas, watts of hydro power, etc.) is projected to reach 678 quadrillion Btu (or 715 exajoules) by 2030 – a 44% increase over 2008 levels (levels for 1980 were 283 quadrillion Btu and we stand at around 500 quadrillion Btu today in 2009).
I wonder what surface area would be required and what type of infrastructural investment would be required to supply that amount of power by using only solar panels. To create fuel that can be used in vehicles and equipment I am assuming that some of the electricity generated would be used to create hydrogen. We should all start wondering about these things since we will have really no other choice* by the turn of the next century.
So to find this out we start with the big number 678,000,000,000,000,000 Btu.
Converting this to KW•h [1 Btu = .0002931 kW•h (kilowatt hours)] makes 198,721,800,000,000 kW•h (199,721 TW•h). This is for an entire year. As a comparison, the average household uses approximately 18,000 kW•h per year (1/11 billion of the total world usage).
We can figure a capacity of .2KW per SM of land (an efficiency of 20% of the 1000 watts that strikes the surface in each SM of land).
So now we know the capacity of each square meter and what our goal is. We have our capacity in KW so in order to figure out how much area we’ll need, we have to multiply it by the number of hours that we can expect each of those square meters of photovoltaic panel to be outputting the .2KW capacity (kilowatts x hours = kW•h).
Using 70% as the average sunshine days per year (large parts of the world like upper Africa and the Arabian peninsula see 90-95% – so this number is more than fair), we can say that there will be 250 sun days per year at 8 hours of daylight on average. That’s 2,000 hours per year of direct sunlight.
Therefore, we can multiply each square meter by 2,000 to arrive at a yearly kW•h capacity per square meter of 400 kW•h.
Dividing the global yearly demand by 400 kW•h per square meter (198,721,800,000,000 / 400) and we arrive at 496,804,500,000 square meters or 496,805 square kilometers (191,817 square miles) as the area required to power the world with solar panels. This is roughly equal to the area of Spain. At first that sounds like a lot and it is. But we should put this in perspective.
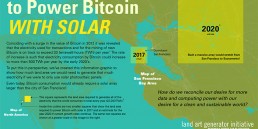
If divided into 5,000 super-site installations around the world (average of 25 per country), it would measure less than 10km a side for each. The UAE has plans to construct 1,500MW of capacity by 2020 which will require a space of 3 km per side. If the UAE constructed the other 7 km per side of that area, it would be able to power itself as a nation completely with solar energy. The USA would require a much larger area and approximately 1,000 of these super-sites.
According to the United Nations 170,000 square kilometers of forest is destroyed each year. If we constructed solar farms at the same rate, we would be finished in 3 years.
There are 1.2 million square kilometers of farmland in China. This is 2 1/2 times the area of solar farm required to power the world in 2030.
Compare it to the Saharan Desert:
The Saharan Desert is 9,064,958 square kilometers, or 18 times the total required area to fuel the world.
By another measure, “the unpopulated area of the Sahara desert is over 9 million km², which if covered with solar panels would provide 630 terawatts total power. The Earth’s current energy consumption rate is around 13.5 TW at any given moment (including oil, gas, coal, nuclear, and hydroelectric).” This measure arrives at a multiplier of 46 times the area needed and shows that my numbers are very conservative.
Compare it to highways:
At a density ratio of 800km per 1000 square kilometers and a total length of 75,440km, the overall area of the US interstate highway system (constructed entirely between 1956 and 1991 – 35 years) is 94,000 square kilometers, or 20% of the overall required area for the world. The US also consumes about 20% of the world’s energy. (if the efficiency of conversion from solar to electricity was 100%, the area of USA highway would be equal to exactly that required to run the world). Indeed if every nation were to embark on a state program of the scale of the US highway system we could be finished with the required infrastructure in 20-40 years.
Compare it to golf courses:
The typical golf course covers about a square kilometer. We have 40,000 of them around the world being meticulously maintained. If the same could be said for solar farms we would be almost 10% of the way there.
Also remember that we are working here with a worst case scenario based on projections for the year 2030 that assume a lot about growth. What could we do to lower the overall Btu load? And what other sources of clean energy could contribute to lower the area needed for solar panels?
Wave:
World wave energy potential = 2,100,000,000,000 KW•h (2,100 TW•h) or 1% of the required load.
Wind:
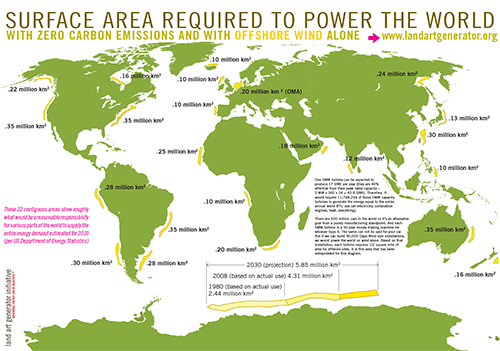
A 5 MW turbine can be expected to produce 17 GWh per year (they are 40% effective from their peak rated capacity – 5 MW x 365 x 24 = 43.8 GWh). Therefore, it would require 11,748,294 of the 5 MW capacity turbines to create the same yearly output. There are 500 million cars in the world so it’s not like that’s an unattainable goal from a manufacturing standpoint. And each 5 MW turbine is a 30 year lifespan money making machine for whoever buys it. The same can not be said for my car. But if we can build 90,000 Cape Wind size installations, we would be there on wind alone. Based on that installation, each turbine requires 1/2 square km of area for offshore sites. This would require 5.85 million square kilometers for 2030 world energy needs.
Here is a graphic for wind based on the notes above. The area in the North Sea is taken directly from the OMA proposal by Rem Koolhaas the pdf of which can be seen here.
click for larger image
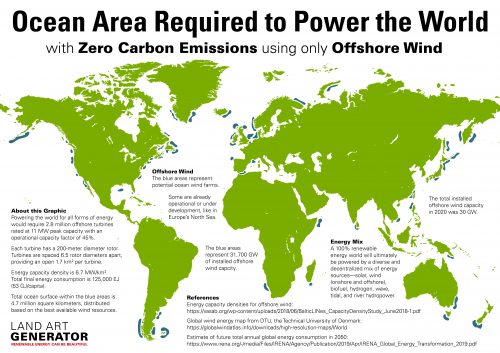
Note: We’ve since updated the offshore wind information graphic:
Existing Hydroelectric:
I say existing hydroelectric because it would be damaging to the environment to construct more dams on rivers. It is difficult to design new large-scale hydro without having a deleterious effect on the ecosystems of the watersheds that are fed by the existing river (wel-planned run-of-the-river projects could be an exception).
As of 2004, hydroelectric power accounted for 6% of the energy production in the world. A conversion of this percentage into energy capacity makes 28 quadrillion Btu (492 quadrillion Btu x 6%). As a percentage of 2030 levels and accounting, this would be more like 4% and accounting for a hopeful decommissioning of existing dams, let’s assume 2%.
So these other sources together have the potential to reduce the area required by 5% – 25% based on the amount of wind power we tap into. Solar panels are really going to have to do the vast majority of the work but a sustainable solution is going to require a great mix of solutions that are diversified as much as possible.
The technologies are improving and the efficiencies are getting greater. We must make it our goal to by the end of this century construct the area required by at the same time reducing our demand and by starting the necessary infrastructure projects today everywhere around the world. Otherwise the consequences are unthinkable.
*As for nuclear power, it currently produces 2.5% of the world’s energy or 10 quadrillion Btu per year. In 2008, the International Atomic Energy Agency (IAEA) predicted that nuclear power capacity could double by 2030, though that would not be enough to increase nuclear’s share of electricity generation. As for the non-renewable resource of uranium, according to the nuclear industry’s own estimation:
Current usage is about 65,000 tU/yr. Thus the world’s present measured resources of uranium (5.5 Mt) in the cost category somewhat below present spot prices and used only in conventional reactors, are enough to last for over 80 years.
80 years does not equal sustainable. And this is only assuming current use rates (the 5% of world energy needs).
An average plant puts out 3 cubic meters of spent fuel each year. Assuming 1000 plants operating around the world (there are 500 today), that would makes 3,000 cubic meters per year. Over those 80 years this would create a volume of 240,000 cubic meters or a cube of 60 meters on each side (bigger than the Pantheon and roughly equivalent to the volume of the Gol Gumbaz Mausoleum. What do we do with that amount of dangerous radioactive material that has a half life of 2 million years?
Update 1: some comments being posted here:
reddit
digg
Update 2: Many comments have to do with the distribution of energy. I reiterate that I am in favor of a maximizing of diversity of clean energy technologies and of points of generation. For example, if we use the figure of 6 billion people in the world, and if over the course of each person’s lifetime they would be responsible for creating a panel to use their equal share of the worldwide demand (never mind the non-equal distribution) then we would each be in for a 9m x 9m square, or something that gives off 33,000 kW•h per year. With a typical home roof installation that assumes 15 kW capacity. Obviously this extreme localization is also not ideal — what is needed is a plan that captures the best balance of centralized/localized and best mix of renewable and clean resources.
Update 3: SES technology would bring down the solar area required to 315,000 square kilometers (based on the 629 kW•h per square meter listed on the site sourced as from Southern California Edison and Sandia National Laboratories). This is a 40% reduction just on efficiency of the capturing device. The technology will continue to get better and better…
[…] You can read more about it here. […]
This blog post provides a fascinating exploration of the immense potential and challenges of transitioning to a renewable energy future. The calculations presented truly highlight the scale of the task ahead and the various factors to consider in achieving a sustainable global energy supply.
It’s intriguing to ponder the surface area needed for solar panels and the infrastructure required to meet the projected energy demands. The comparison with existing landmasses and human-made structures offers valuable perspective on the feasibility of such an endeavor.
Moreover, the discussion on alternative energy sources like wind and hydroelectric power adds depth to the conversation. Diversifying our energy mix seems crucial for long-term sustainability.
As technology continues to advance, solutions like SES technology mentioned in Update 3 could significantly impact efficiency and reduce the required solar area.
For those interested in exploring solar energy solutions further, I recommend checking out itekenergy.com. Their range of services, including solar panels, installation, and troubleshooting, can be invaluable for individuals and businesses looking to embrace renewable energy.
This post prompts important questions about our energy future and underscores the importance of proactive efforts towards a cleaner, more sustainable world.
The idea of turning solar energy generation into a work of art is nothing short of brilliant. It’s a fantastic way to make clean energy not only functional but also aesthetically pleasing. The “Solar Serpentine” concept, with its undulating curves and integration into the landscape, is both practical and visually captivating.
Thanks for sharing your thoughts about energy efficient.
Regards
[…] Report by Land Art Generator : – https://landartgenerator.org/blagi/archives/127 […]
[…] Report by Land Art Generator : – https://landartgenerator.org/blagi/archives/127 […]
[…] TOTAL SURFACE AREA REQUIRED TO FUEL THE WORLD WITH SOLAR- https://landartgenerator.org/blagi/archives/127 […]
[…] in this way, we would need a massive amount of surface area for all the panels needed, almost 200,000 square miles Where would we get all this space? Because transparent solar cells can be integrated into any sheet […]
[…] but you can’t conduct both positive and negative charges on the ground. The only way to get the required amount of energy from the sun is to use electricity or, more commonly, solar […]
[…] is assuming a 100% capture rate, however. Some argue that the actual area could be as much as 8 times bigger than this as the capture rate will be much lower in reality. Even still, the point is the same: you can see […]
La definición de arquitectura es el arte y la técnica de diseñar, proyectar y construir edificio, modificando el hábitat humano y estudiando la estética.
[…] the black boxes alone were filled with networked solar arrays, the world would have no need for any other energy source. Sustainability becomes even easier to imagine if we consider the other […]
[…] data from the Land Art Initiative, we can determine that 1 sq km would output 1,364,720,600,000 Btu (based on 2009 projections). This […]
Solar power does not create energy in a particularly handy manner, despite the fact that the calculation looks magnificent when displayed in this way. Batteries are inefficient, cumbersome, and costly. The present infrastructure is based on a liquid kind of energy. This is why biofuels are so appealing because they have the ability to transform sunlight into a high-efficiency diesel form.
[…] who still haven’t corrected their errors 12 years later. They state their assumptions clearly here. I’ve highlighted them […]
See my YouTube Channel zeropollution2050 (one word)….
In 2050 A Solar Panels based AV (AgriVoltaics) System can ALONE provide ALL the Energy Mankind needs (not just Electricity Customers) on 1 Million km2 of Farmland… which will still continue to produce Food below as before … in other words… no need to divert or look for “unused/undeveloped, remote land, oceans etc….
The maths is simple……
1. Global Population in 2050… 10 Billion
2. Average Energy Consumption – 18,000KWhrs/person/yr (taking credit for Energy Efficiencies, Demand Side Management, etc.. over the next 30 years)
3. Energy Required 180,000TWhrs/yr (18,000KWhrs X 10 Billion).
4. Solar System Required (1200KWhrs/KW/yr)… 150TW
5. Area of AV Land needed (150W/m2… quite low to accommodate T&D Losses etc..) 1Million km2.
6. Only 7% of Agricultural Land needed for the AV Option (Total Global Agricultural Land is 15Million km2).
7. Estimated Cost $200 Trillion, including 20-25% Energy Storage for Sunset-to-Sunriset.
The above YouTube Channel has a Website linked to it. The WebSite has a Calculator for anyone to figure out a AV PLan for their needs… nation, Region, etc…
AAKASH GREEN is a leading Renewable Energy Company in Dubai engaged in the bamboo plantation and creating sustainable environment friendly sources of energy for the use of mankind.Please visit our website for more information.
[…] 496,805 square kilometers (191,817 square miles) (here) […]
Regarding powering the world with only Wind, you say:
“each turbine requires 1/2 square mile of area for offshore sites. This would require 5.85 million square kilometers for 2030 world energy needs.”
and previously you say:
“Therefore, it would require 11,748,294 of the 5 MW capacity turbines to create the same yearly output.”
so the first sentence does not make sense UNLESS you men “1/2 square km” instead of “1/2 square mile”. And if this is the case, it does not correspond with the image label that says “1.7 km2 per turbine”. And also in the image is not clear if the energy demand is for the 2030 year.
I am confuse now… I really want to know how much area we need to power the world with wind.
See: https://landartgenerator.org/blagi/archives/77315
This seems unrealistic given a recent Solar Project in Australia to generate 10GW, roughly enough to power 1 million homes and requiring 120 Square Kilometres. To me the numbers don’t ad up, not to mention comments further down that make note of agriculture and cattle grazing between rows. I don’t know how many industrial sized solar farms you have physically visited however this is not viable. For a solar farm to be constructed the land mush be clear felled of all vegetation and once the panel arrays are install the ground beneath and between is effectively inactive soil and not sustaining for either. The idea of solar powering the worlds needs has to be presented in a realistic manner as articles and one sided research as this only fuels mis-information and unguided pushes by those who do not understand the worlds energy requirements and more importantly a practicable and measure approach.
Thanks for your comment. The areas are the modules themselves, not the auxiliary areas between them.
That is not correct. China effectively turned a desert Into Farmland by installing a solar farm.
https://youtu.be/CSNSAt5wOj8
Thanks Alain. That’s a great project! The more we can share land use with agriculture, reservoirs, rooftops, etc. the better.
Has anyone actually checked these figures against actual use of solar panels? I ran a 4.8kw system for 3 years (2014-17) when I was recording production. It covered 35 m2 with 22x 250w panels and produced an average of 7155 Kwh annually. That is about half the theoretical output calculated above (35×400=14000 Kwh). This was in Cairns, Queensland , Australia where there would have been at least as much sunlight as allowed for above.
No allowance has been made for powerline losses (25%) or the fact that base power is still required for the dark hours of the day so effectively you have to have two power generating systems. Such redundancy is going to double the cost of power unless we can store a surplus of daylight power to get us through the night. There are not many opportunities left for pumped hydro. Hydrogen would seem the best bet but it is difficult to store because it leaks through most materials.
At the moment the only non-carbon solution that is cost effective is nuclear. Anything else is wishful thinking.
You make some good points. We’re in the process now of updating our global surface area graphic for a mix of renewable energies. On the flip side of the transmission losses, the information graphic does not account for the greater efficiency of electrical energy over internal combustion energy. EVs are more than twice as efficient at converting fuel into motion than gas-powered automobiles for example. The 2030 projections of global energy use turned out to be inflated as much of the world has greatly increase energy efficiency. When looking at energy land density we should account for the shared land use of some solar installations on rooftops, installed in concert with agriculture (solar greenhouses and agrivoltaics), and over bodies of water. The graphic is only counting the area of the solar cells themselves, not the space between them. There are many nuances in either direction that are difficult to account for in such a simplified graphic.
When will the updated graphics be available?
We’ll have an updated graphic for all forms of renewable energy posted in April, 2021. Thanks for your patience!
Can you post a link of the apdated graphic
THX
I got plot of land in uk; can any body want to use this this to Genrate electric with solo panels? Contact me 07380353424 uk
[…] Solar 1[1] Land Art Generator, Total Surface Area Required to Fuel the World with Solar, Aug 2009[2] Ibid[3] Radiolocman, Los Lunas, New Mexico Unveils Cutting Edge Solar Technology, June 10, […]
In reality (counting real solar farms output, not theoretical solar energy) the average of yearly output is about 100 GWh/year/sqkm (same as kWh/year/sqm) so the area will be 4 times larger, at about 2 million sqkm.
Other land uses can occur within the spaces between rows of solar panels in a real solar farm. Grazing, agriculture, recreation, etc. The graphic intends to display only the area of the solar cells.
[…] Total Surface Area Required to Fuel the World With Solar […]
Experience in California shows that photovoltaics produce about 15 watts/square meter, so multiply all numbers here by 10X. In the Sahara, it would be about 20 w/m2, so only 8X larger would suffice.
Providing only for average power production fails. Peak power must be met or the system collapses. The diurnal variation of solar altitude and the air mass show that the power produced is 1/4 the power demand diurnally, so a four times larger PV panel is required. to charge the “backup” with enough energy to meet the power demand for the period when the sun is not above 30 degrees altitude angle. The seasonal variation at a latitude of 34 degrees (California-Arizona) is 2.5:1 summer to winter, again demanding a 2.5 times YET larger PV facility, OR an equivalent back up capability. Such a backup capability is not available. The largest pumped power facility runs for 11 hours before exhaustion.
PV facilities require replacement at least every 15 years, as connection fails, parts deteriorate, etc. That means demolition and replacement PV to continuously build 10’s of thousands of square kilometers EVERY year. It is a gift which keeps on giving.
There ARE other and better solutions. Would you like to know more?
[…] petajoules of power in 2017-18. or 6,172 x 10^15 / (1000 * 3600) = 1714 billion kw/h. The usage of land artwork generator’s beneficiant 400kwh / yr / sq. metre, Australia would wish four.three billion sq. metres of panels, or 4286 sq. kilometres (1654 sq. […]
[…] But the solutions should not be beyond us: Total Surface Area Required to Fuel the World With Solar […]
[…] collectors that could capture 100 per cent of the energy). A more realistic estimation by the Land Art Generator Initiative assumed a 20-per-cent capture rate and put forward an area approximately eight times bigger than […]
[…] Image via Land Art Generator Initiative […]
[…] Image via Land Art Generator Initiative […]
[…] Image via Land Art Generator Initiative […]
[…] Image via Land Art Generator Initiative […]
Thanks for your important information. Electricity is now an important part of homes & industries. The usage of electricity is increasing day by day. The generator is the best solution for Power backup. For a smooth running of the generator need proper maintenance also. Without power, the world would never be able to innovate.
[…] total surface area of the earth required to produce enough power through solar alone is not as much as you might think. By one estimate it would require an area of 496,805 square kilometers. This is not much if it is […]
[…] area the size of Spain covered in solar panels would generate enough power to satisfy the world’s energy needs. That would remove the need for all other forms of renewable […]
[…] LandArt analyzed the amount of solar required to power the world and produced a great infographic (read here). […]
[…] conceived, the biodomes would be powered by a mixture of solar and wind energy, ensuring its self-sufficiency and offsetting carbon emissions. But the project's […]
[…] https://www.good.is/infographics/sol…all-of-america Here's the estimate to power the WORLD: Total Surface Area Required to Fuel the World With Solar | bLAGI 191,817 square miles – to power all humans on earth. Just from solar. Wind turbines are now often […]
[…] By the same token, staying on daylight saving time all year can help increase solar energy efficiency. Solar power is one of the most promising sources of sustainable energy, and it’s being widely embraced both in corporate and private sectors. Used correctly, solar panels have the potential to power the entire world. […]
[…] collectors that could capture 100 per cent of the energy). A more realistic estimation by the Land Art Generator Initiative assumed a 20-per-cent capture rate and put forward an area approximately eight times bigger than […]
[…] de afinar algo más presentan estimaciones similares por grandes regiones del mundo (por ejemplo ésta). Sin embargo, cuestiones críticas como el hecho de que la mayor parte de las tierras actualmente […]
[…] were recently contacted by Rebecca Harrington at Tech Insider with a request to use our Surface Area Require to Power the World with Solar information graphic in a new video that they have produced. You can see the piece […]
[…] provide clean power for homes, communities and businesses, and help cut global carbon emissions. (Math done by Land Art Generator) In the year 2030 the US Energy Information Administration’s estimation of global energy […]
[…] or some people much smarter than myself, in this area of expertise, found that all out for us here, http://landartgenerator.org/blagi/archives/127, sweet right? I know, these people really know their stuff, not to mention that it’s […]
[…] NREL reached out to us recently to let us know that our Total Surface Area Required to Fuel the World with Solar not only shows that we can generate 2030 energy levels with solar alone, but actually we […]
[…] by solar energy (assuming some kind of superior storage for evenings and cloudy days) you would need 500,000 square km of land devoted simply to the panels — an area the size of Spain. And you’d need more to provide the interconnections. Until […]
[…] *Ok, I know there are a lot of things to be worked out – for example, energy generated from renewable sources such as solar or wind cannot be stored nearly as well as we would like, and the distribution of electricity in the grid can be a lot better. Renewable energy generation is getting more efficient every year, and the amount of solar cells we need to power the planet is not really that much. As this paper states, “Covering 0.16% of the land on Earth with 10% efficient solar conversion systems would provide 20 TW of power, nearly twice the world’s consumption rate of fossil energy and the equivalent 20,000 1-GWe nuclear fission plants”. More details can also be found here. […]
[…] is 136% that available on the surface due to the reflective effect of the atmosphere itself. The surface are required to fuel the world with solar would therefore be 74% of that required on a land-based […]
[…] have been some detractors to the idea that we can fuel the world entirely with solar energy by 2030. It seems to me from the numbers that […]
[…] If you really wanted to sequester your carbon, you should plant 100 green leafy trees (birch, maple) for EACH ton of CO2 you emit every year. So if you are in the United States, you would have to plant 2,400 trees in your lifetime. Some trees in the tropics can sink carbon at a rate of 40 trees per ton but it is impossible to place an exact number on tons per tree since there are too many variables (soil, sunlight, species, maturity, etc.). 100 trees per ton is a safer bet if you want to be sure. Obviously, every American is not going to plant 2,400 trees (who has 5 empty acres?), so let’s get real about modifying our behavior (individually and collectively) instead. Carbon offset programs that fund reforestation efforts are positive, but will never even come close to scratching the surface of the problem. Five acres of trees per American equals 1,500,000,000 acres – 1.5 billion acres. That’s 6,070,284 square kilometers. That’s 60% of the entire country (and far less area than would be required to fuel the entire world with solar power). […]
[…] like a good average. It is interesting to compare this graphic with the similar graphic of the surface area required to fuel the world with solar power. As the world prepares for Copenhagen on December 7th, we should all get it clear in our heads […]
[…] To figure this out, the folks at Land Art Generator did the following math: […]
[…] Land Art Generator InitiativeFinding all of the squares. […]
[…] To figure this out, the folks at Land Art Generator did the following math: […]
[…] To figure this out, the folks at Land Art Generator did the following math: […]
[…] To figure this out, the folks at Land Art Generator did the following math: […]
[…] first exhibition of LAGI in 2009, which introduced the concept of artwork powering cities, and the early educational content we began to create that year in preparation for the 2010 launch of our first (what was to become […]
[…] (Full Explanation) […]
[…] data from the Land Art Initiative, we can determine that 1 sq km would output 1,364,720,600,000 Btu (based on 2009 projections). This […]
[…] solar collectors that could capture 100 per cent of the energy). A more realistic estimation by the Land Art Generator Initiative assumed a 20-per-cent capture rate and put forward an area approximately eight times bigger than […]
[…] of the first groups to map this out was the Land Art Generator Initiative, which uses art to promote clean energy. In 2009, they calculated that we’d only only have to […]
[…] (From Land Art) According to the US Department of Energy (Energy Information Administration), the world consumption of energy in all of its forms (barrels of petroleum, cubic meters of natural gas, watts of hydro power, etc.) is projected to reach 678 quadrillion Btu (or 715 exajoules) by 2030 – a 44% increase over 2008 levels (levels for 1980 were 283 quadrillion Btu and we stand at around 500 quadrillion Btu today in 2009). […]
I doubt the wind turbines are going to work. On the map, look at the Netherlands(an import-export based economy which has one of the largest harbours in the world). The area of the wind-turbines that is supposed to be placed before their coast is larger than the country itself. That is going to have devastating effects on their economy, because shipping channels might get blocked and the ships that need to constantly be maintaning such a large ammount of wind turbines can deffinitely cause trouble when they are using the shipping channels. You could say “we will move the turbines to another location, but on any other location the turbines will do the same to any harbours that are on the coast they are now blocking.
[…] the Land Art Generator Initiative, here’s a more realistic depiction of what a distributed power network that could fill the […]
[…] to the Land Art Generator Initiative, even if the current crop of solar panels can reach up to 20 percent efficiency only, we just need […]
[…] reach the point where the cost of energy is, for all intents and purposes, insignificant. Some estimates indicate that the amount of terrestrial surface area needed to power the world solely by […]
[…] To figure this out, the folks at Land Art Generator did the following math: […]
[…] would the Earth look like if it were powered by solar panels? Land Art Generator Initiative used some fancy calculations to find out. According to Land Art’s calculations, we would need 496,805 square kilometers or […]
[…] would the Earth look like if it were powered by solar panels? Land Art Generator Initiative used some fancy calculations to find out. According to Land Art’s calculations, we would need 496,805 square kilometers or […]
[…] would a earth demeanour like if it were powered by solar panels? Land Art Generator Initiative used some imagination calculations to find […]
[…] – Land Art Generator – Business […]
[…] | Land Art Generator | Business […]
[…] | Land Art Generator | Business Insider var urlIntext = […]
[…] would the earth look like if it were powered by solar panels? Land Art Generator Initiative used some fancy calculations to find […]
[…] To figure this out, the folks at Land Art Generator did the following math: […]
[…] would the earth look like if it were powered by solar panels? Land Art Generator Initiative used some fancy calculations to find […]
[…] To figure this out, the folks at Land Art Generator did the following math: […]
[…] To figure this out, the folks at Land Art Generator did the following maths: […]
[…] To figure this out, the folks at Land Art Generator did the following math: […]
[…] To figure this out, the folks at Land Art Generator did the following math: […]
[…] To figure this out, the folks at Land Art Generator did the following math: […]
[…] And while it’s useful in the map to show the solar installations as a square bunched together, this area could actually be spread over more space, with solar panels tucked away on rooftops and spread across deserts. .u9bf0fa22990d6284cf65183ac545be47 { padding:0px; margin: 0; padding-top:1em!important; padding-bottom:1em!important; width:100%; display: block; font-weight:bold; background-color:inherit; border:0!important; border-left:4px solid inherit!important; text-decoration:none; } .u9bf0fa22990d6284cf65183ac545be47:active, .u9bf0fa22990d6284cf65183ac545be47:hover { opacity: 1; transition: opacity 250ms; webkit-transition: opacity 250ms; text-decoration:none; } .u9bf0fa22990d6284cf65183ac545be47 { transition: background-color 250ms; webkit-transition: background-color 250ms; opacity: 1; transition: opacity 250ms; webkit-transition: opacity 250ms; } .u9bf0fa22990d6284cf65183ac545be47 .ctaText { font-weight:bold; color:inherit; text-decoration:none; font-size: 16px; } .u9bf0fa22990d6284cf65183ac545be47 .postTitle { color:inherit; text-decoration: underline!important; font-size: 16px; } .u9bf0fa22990d6284cf65183ac545be47:hover .postTitle { text-decoration: underline!important; } MUST READ Gabourey Sidibe is both fan, star when it comes to 'Empire'To figure this out, the folks at Land Art Generator did the following math: […]
[…] energy. If we needed to power the world on just solar energy, we would only need a space of about 500,000 square kilometers, however, some sources estimate that we would only need an area of about 315,000 square kilometers. […]
[…] the total area needed to cover global energy consumption through photovoltaics would be close to 500,000 km^2 at an efficiency of 20%. If we divide this number by 20 we would only need 25,000 km^2 to cover the […]
[…] out. That’s a ton of energy as shown above! But we don’t need that much energy. According to this site, we don’t need anything near the size of a dyson sphere to provide all the energy we need as a […]
[…] de capturer 100% de l’énergie). Mais selon une estimation plus réaliste, de l’initiative Land Art Generator, avec un taux de capture de 20%, une surface environ huit fois plus grande que celle […]
[…] de capturer 100% de l’énergie). Mais selon une estimation plus réaliste, de l’initiative Land Art Generator, avec un taux de capture de 20%, une surface environ huit fois plus grande que celle […]
[…] solaires capables de capturer 100% de l’énergie). Mais selon une estimation plus réaliste, de l’initiative Land Art Generator, avec un taux de capture de 20%, une surface environ huit fois plus grande que celle évoquée dans […]
[…] collectors that could capture 100 per cent of the energy). A more realistic estimation by the Land Art Generator Initiative assumed a 20-per-cent capture rate and put forward an area approximately eight times bigger […]
[…] From LandArtGenerator.org. Image here. Science here. […]
[…] groups to raise this question land requirements for solar energy and provide a useful map, was the Land Art Generator Initiative, which uses art to promote clean energy. In 2009, they calculated that we’d only only have to […]
[…] groups to raise this question land requirements for solar energy and provide a useful map, was the Land Art Generator Initiative, which uses art to promote clean energy. In 2009, they calculated that we’d only only have to […]
[…] solaires capables de capturer 100% de l’énergie). Selon une estimation plus réaliste de l’initiative Land Art Generator, avec un taux de capture de 20%, il faudrait une surface environ huit fois plus grande que celle […]
[…] التقاط 100٪ من الطاقة). وهناك تقدير أكثر واقعية وضعته مبادرة مولد فن الأرض (Land Art Generator Initiative)، يفترض معدل التقاط 20٪ ومساحة أكبر […]
[…] solar collectors that could capture 100 per cent of the energy). A more realistic estimation by the Land Art Generator Initiative assumed a 20-per-cent capture rate and put forward an area approximately eight times bigger than […]
[…] solaires capables de capturer 100% de l’énergie). Mais selon une estimation plus réaliste, de l’initiative Land Art Generator, avec un taux de capture de 20%, une surface environ huit fois plus grande que celle évoquée dans […]
[…] of the first groups to map this out was the Land Art Generator Initiative, which uses art to promote clean energy. In 2009, they calculated that we’d only only have to […]
[…] التقاط 100٪ من الطاقة). وهناك تقدير أكثر واقعية وضعته مبادرة مولد فن الأرض[2] (Land Art Generator Initiative)، يفترض معدل التقاط 20٪ ومساحة أكبر […]
[…] التقاط 100٪ من الطاقة). وهناك تقدير أكثر واقعية وضعته مبادرة مولد فن الأرض (Land Art Generator Initiative)، يفترض معدل التقاط 20٪ ومساحة أكبر […]
[…] the surface area required to power the planet’s electricity needs in 2030 would blanket the entirety of Spain (lower estimates exist for global electricity demand as of 2010). You would need three […]
[…] We are surrounded with an abundance of clean energy, if we only had a way to harness it it. Most people probably know about solar energy, that we would only need to harness a tiny fraction of it to power the entire world (e.g. the Sahara desert has eighteen times the surface area needed to power the entire world). […]
[…] power source. Second, the energy density of solar is really, really low. We would need to cover 496,805 square kilometers of area with solar panels to satisfy the world’s projected energy consumption in 2030. While […]
[…] solares capaces de capturar el 100% de la energía). Según una estimación más realista de Land Art Generator Initiative , con una tasa de captura del 20% haría falta una superficie alrededor de ocho veces mayor que la […]
[…] calculates that the land area necessary to supply all or the world’s energy needs with solar http://landartgenerator.org/blagi/archives/127. The area required is about 192,000 square miles, approximately the area of Spain, or 28 percent of […]
[…] calculates that the land area necessary to supply all or the world’s energy needs with solar http://landartgenerator.org/blagi/archives/127. The area required is about 192,000 square miles, approximately the area of Spain, or 28 percent of […]
[…] calculates that the land area necessary to supply all or the world’s energy needs with solar http://landartgenerator.org/blagi/archives/127. The area required is about 192,000 square miles, approximately the area of Spain, or 28 percent of […]
[…] calculates that the land area necessary to supply all or the world’s energy needs with solar http://landartgenerator.org/blagi/archives/127. The area required is about 192,000 square miles, approximately the area of Spain, or 28 percent of […]
[…] calculates that the land area necessary to supply all or the world’s energy needs with solar http://landartgenerator.org/blagi/archives/127. The area required is about 192,000 square miles, approximately the area of Spain, or 28 percent of […]
[…] solaires capables de capturer 100% de l’énergie). Selon une estimation plus réaliste de l’initiative Land Art Generator, avec un taux de capture de 20%, il faudrait une surface environ huit fois plus grande que celle […]
[…] solaires capables de capturer 100% de l’énergie). Selon une estimation plus réaliste de l’initiative Land Art Generator, avec un taux de capture de 20%, il faudrait une surface environ huit fois plus grande que celle […]
[…] […]
[…] solaires capables de capturer 100% de l’énergie). Mais selon une estimation plus réaliste, de l’initiative Land Art Generator, avec un taux de capture de 20%, une surface environ huit fois plus grande que celle évoquée dans […]
[…] and a half Marylands worth of solar panels. This seems like a lot, but (according to this source: http://landartgenerator.org/blagi/archives/127) it is only about half the total surface area of highways in the US. In short, if we get to the […]
[…] with those figures, and then a lot of back-of-an-envelope math, Land Art Generator Initiative has mapped the surface area required to provide the entire planet’s energy from the sun in 2030. They also did one for […]
[…] compare the JOBS that will be LOST to the jobs you project will be CREATED………….goodness Land Art Generator Initiative — global solar panel space required to fuel the entire world at higher population than present. […]
[…] http://landartgenerator.org/blagi/archives/127 […]
[…] (Map source.) […]
[…] Total Surface Area Required to Fuel the World With Solar – I appreciate the time and effort you went through to post these numbers and all of the information you provided. I would like to offer a global solution to the solar …… […]
[…] http://landartgenerator.org/blagi/archives/127 […]
[…] data from the Land Art Initiative, we can determine that 1 sq km would output 1,364,720,600,000 Btu (based on 2009 projections). This […]
[…] energy” is based on the idea that we have a scarcity of it, which we do not. We have an inexhaustible daily supply of it shining down on us every day, more than enough to power the entire world several hundred times over. It is not the […]
[…] the full article. Post Published: 05 August 2014 Found in section: Earth Systems […]
[…] http://www.landartgenerator.org/blagi/archives/127 Share on TumblrjQuery(document).load(function(){ stLight.options({publisher:''}); });emailprintDigg Diggvar dd_offset_from_content = 40;var dd_top_offset_from_content = 0;var dd_override_start_anchor_id = "";var dd_override_top_offset = "";Spread the news.. energy consumption markets panels solar energy wind world 2009-09-04 WoR Network Editor […]
[…] the Land Art Generator Initiative, here's a more realistic depiction of what a distributed power network that could fill the world's […]
[…] […]
Professor Einstein once said “for every action there is an opposite and equal reaction”!
A question on the pushing power of reflective energy. Considering the oceans etc. are already reflecting sunlight, How many square miles of reflecting solar panels would it take for the reflective “push” of the sun to push the earth out of orbit?
They are now using this reflective sun power to push spacecraft that can attain incredible speed, however if “spaceship Earth” gets pushed even slightly out of orbit, We all perish!
[…] and inexpensively installed on individual homes, offices, etc.). However, another site, that of the Land Art Generator Initiative, has a fascinating look at how much land area would be needed (as of 2009) to produce the energy […]
[…] #8: With current technology, it would take about 191,817 square miles of solar panels to supply all of the world’s power needs in 2030 (about 40% more power than we use […]
“…so they’re all getting their listed 20% efficiency rating and not the ~20-(3+.5(# yrs after 1st year)% efficiency they’ll get during their service lifetime.”
Sorry, make that ~20(.97x_1-.5x_n)% efficiency they’ll get over the course of their service lifetime.
I see the calculations for solar panels required to meet global energy demand presuppose the existence of a superconducting global smart grid so that we don’t have to pay big transmission loss penalties sending electricity generated in the Sahara, or from a small number of big solar farms, all over the world. Otherwise, we’ll need more solar panels than these calculations suggest – either to cover the transmission losses or to compensate for the fact that we’ll have to move our solar panels much closer to home, to places where our panels will start their service lives generating more like 175-350 kW/m^2/yr instead of 400 kW/m^2/yr. We’re also assuming that our hundreds of thousands of km^2 of solar panels are all new, so they’re all getting their listed 20% efficiency rating and not the ~20-(3+.5(# yrs after 1st year)% efficiency they’ll get during their service lifetime. We’re also assuming all of them are completely clean all the time, which would be quite an impressive statistic if they’re operating in environments with lots pollen, dust and damaging wind-blown sand, because the power output of a dirty solar panel can easily fall 40-70% or more. And we’re assuming that it’s good enough for the total energy output from all our solar panels to be equal to the globe’s total energy demand, and that we can ignore any mismatch between energy produced by our solar panels and energy demanded at any given moment. Even though that little detail happens to matter immensely. Well, under those assumptions, solar power looks incredibly expensive, and there are certainly much cheaper ways to achieve a decarbonised energy portfolio, but I suppose it is technically doable.
I think when you run through the calculations a bit more, it becomes clear that solar power, and even solar and wind power together, are only going to play a globally relatively minor role (though they may be major players in certain regions) in a clean energy future.
Actually, PV panels are icrbidnley cheap right now.The only reason they appear expensive is when compared agaist fossil fuels, like oil, which are already becoming MUCH more expensive, and which will continue to do so for many, many year.Buy PV now, or kick yourself for not doing so later.
[…] (image credit) Share this:EmailFacebookTwitterRedditGoogleLinkedInStumbleUponDiggLike this:Like Loading… […]
[…] It really is a matter of choice, urgency, and priorities. Total Surface Area Required to Fuel the World With Solar (source: http://www.landartgenerator.org/blagi/archives/127) […]
[…] http://landartgenerator.org/blagi/archives/127 ‹ Vancouver urban farm, using unused spaces Posted in Energy […]
[…] Another report suggests that we’d need to cover 191,817 square miles of surface with solar PV panels to produce enough power to support the world. This is about the size of Spain although as the author notes, the Sahara desert alone is 18 times the required size so lack of available land shouldn’t be a problem. […]
[…] estate. It’s estimated that between approximately 366,375 (solarenergyfactsblog.com) and 500,000 (landartgenerator.org) square kilometers dedicated to solar plants are required for global power. While this number may […]
[…] Total Surface Area Required To Fuel The World With 100% Solar and 100% Wind “According to the United Nations 170,000 square kilometers of forest is destroyed each year. If we constructed solar farms at the same rate, we would be finished in three years.” […]
Great research and calculations. Thanks.
I was wondering about your source for the wave energy calculation, a new study available at: http://www.oceanor.no/related/59149/paper_OMAW_2010_20473_final.pdf
puts the world wave resource at about 4 TWh per h.
Also if you could comment of this, since sea water has a density of about 800 times that of air (wind) how do the wave and wind systems compare, it seems to me there is a great deal of torgue in the waves compared to wind, yet waves can theoretically supply only a small percentage compared to wind. Thanks.
Haven’t read it all, but did you also take into account that the area of a solar farm is not covered 100% with solar panels? There’s roads, some space between every panel and so on. I guess that would amount to quite a factor of more area required?
Thanks! We’re assuming that all the installations would be spread our anyway, not lumped together. This is just to make the graphic readable. Most of the installations will probably end up on roof tops.
Julian is right! Most of the installations can’t end up on the rooftops, because in most of the metropolitan areas there is no “rooftop” space. So, at least 80% of the installed solar panels will end up in the big solar fields and therefore at least 2x factor is in order for all of your calculations.
“…in most of the metropolitan areas there is no ‘rooftop’ space.” There isn’t? What keeps the rain out of the buildings? Of course there’s rooftop space. Look at an aerial picture of a city and you’ll see lots of rooftop space. It’s true that some urban roofs are unsuited for solar panels because they are overshadowed by taller neighbors, but there are many others that could take PV panels just fine.
Certainly, but we all need to realize that adding Solar to their house is an asset which could raise the actual worth of their house if / when they come to a decision to sell. With the environment the way it is going we simply cannot disregard any system that presents 100 % free power at no cost to both the buyer and more notably the environment!
Unless I missed it you missed geothermal energy and in particular enhanced geothermal energy. Several years ago the Geological Survey of Canada produced a report called “Geothermal Energy Resource Potential of Canada” do a web search for GEOLOGICAL SURVEY OF CANADA
OPEN FILE 6914 – it’s a 54MB pdf file. 100 enhanced geothermal stations across Canada wouls produce all the energy needed for all of North America.
I appreciate the time and effort you went through to post these numbers and all of the information you provided.
I would like to offer a global solution to the solar issue, given the numbers you have provided that would be needed for such a venture.
Instead of thinking of the this as such a big problem it may be simpler to tackle it one small step at a time. I’ve been planning on electroplating a dish (that any satellite cable service can readily provide) to create a reflective parabolic dish, to which I am going to attach a 10 cm^2 photovoltaic and system to provide electricity and heat my water at the same time.
Walking around any neighborhood in the US you can see it is very acceptable to install this type of dish on your home… what if we put one on every house? Not only on houses, but on telephone poles also? There are somewhere around 175 million telephone poles in the US… that is roughly 17.5 million m^2 of solar panels on telephone poles by themselves. Since concentrated solar is about 40% more efficient, a reasonable number equivalent would be around 20 million m^2 of solar. Let’s say there are 100 million houses and half would be willing to put these up… 25 million m^2 of solar in the US, would that be enough for the country?
This way would also be able to take advantage of our already established (outdated) grid system while creating 1000’s of installation, maintenance and clerical jobs all over the country. Global, too.
Government/big business will never allow energy to be “free”, though.
My own idea would be to directly turn the solar into hydrogen that could be transported from the creation point to the use point with almost no loss of energy across the distance from point to point, while pumping clean O2 into the atmosphere.
In less fortunate places on the planet this would also provide much needed clean water… and replenish the Earth’s clean water supply at the same time.
Clean air, clean water and electricity from the sun… what a dream.
[…] That the world’s entire demand of electricity could be supplied with a solar farm the size of … Sent in by Max J. […]
[…] http://landartgenerator.org/blagi/archives/127 Share this:TwitterFacebookLike this:LikeBe the first to like this. This entry was posted in […]
[…] That the world’s entire demand of electricity could be supplied with a solar farm the size of … Sent in by Max J. […]
[…] See just how little land area we would need as a planet to power all of humanity on 100% solar energy with this Land Art Generator Initiative map. […]
If we can build millions of miles of roads, millions of buildings, millions of factories, billions of motor vehicles; then we can build the massive infrastructure required to supply our energy needs through renewable, and mostly non-polluting, sources.
This undertaking will provide millions of jobs, a new and vibrant world economy, and a better life for everyone on this planet.
[…] How much land would we need to cover with solar panels to meet the entire world’s energy needs? The answer might surprise you. Find out in this visualization from LandArtGenerator.org. […]
Hi there, I discovered your blog by means of Google whilst searching for a similar subject, your site got here up, it appears great. I have bookmarked it in my google bookmarks.
[…] – you can only extract coal once – while wind and solar are perpetual energy sources. LAGI has lots more comparison of energy footprints if you want to further dig into this […]
I think more than anything, this just shows that we can’t simply rely on one source… Also, was your calculations for area based on area of the panel or area required for each panel… having a 2 x2 m panel doesn’t mean it only takes up 4 square meters…
This just shows how unfeasible complete switch would entail, remember that there would need to be mass storage facilities that would be equally or greater in expense. You are also looking at 20% efficiency, 5% above what is normal. As well as the fact you forgot to consider decreasing efficiency with each year, so either extend the area of the panels, or replace panels….
I think solar will play a role in our energy independence, but not a complete role, no energy source will do that (exception of fusion perhaps)
[…] to Power the World (with zero carbon emissions and with solar alone), assumptions and methodology here, it looks like a California of solar panels could more than power the […]
Last I checked, average capacity factor for wind turbines was around 20 %, not 40 %, at least in Germany/Finland/Sweden (although offshore might be somewhat more efficient and some individual WPPs in optimal locations might get near 40 %).
Also, 80 years of uranium for nuclear power plants assumes:
1. “in the cost category somewhat below present spot prices” 2. “used only in conventional reactors”
3. No new reserves are found and unconventional reserves are not used.
1: “It is estimated that for every doubling of price, that the supply of uranium that can be econimicaly mined is increased 2.5 times.” (keep in mind that fuel is around 9 % of the costs of NPP)
2: Breeder reactors and thorium reactors could give thousands of years of nuclear power.
3: NEA estimated 10,5 million metric tons of undiscovered uranium, compared to 5,5 million in reserves at 59$/lb. Also, around 22 million metric tons in phosphate deposits at around current price point. And finally there are 4 gigatonnes in seawater (current tech/econ allows “mining” at ~$300/lb) which would mean billions of years with breeder reactors.
[…] total surface area required to fuel the world with solar […]
[…] Good news: We have the renewable energy if we would just harness it. An article from the Land Art Generator website includes a very nice numerical analysis of how much energy humanity needs, how that has […]
[…] se puede ver la imagen en grande. Y aquí, el proceso de cálculo que se ha seguido. Vía Information Is Beautiful. TweetShare via […]
IT IS INDEED WITH GREAT PLEAURE AND INTEREST, I HAVE CAREFULLY READ THE AFORESAID LINES WHEREIN YOU HAVE TAKEN GREAT EFFORT TO ENLIGHTEN THE WORLD OVER ABOUT THE IMPORTANCE OF HARVESTING THE ABOUNDANTLY AVAILABLE SOLAR ENERGY BY THE MANKIND FROM NOW ONWARDS. WE ARE REEALLY ON THE BRINK OF SEVERE ENERGY STRINGENCY AND RECESSION IT IS ALMOST AT THE DOOR STEP OF EVERY HOME AND DWELLING PLACES.IT IS NEEDLESS TO STRESS AT THIS CRITICAL JUNCTURE TO THINK UNILATERALLY AND SYNCHRONOUSLY BY ALL CLASS OF PEOPLE IRESPECTIVE OF CAST, CREED,AND GENERATION ARCHITECTURE.
IT IS HIGH TIME NOW, TO IMMEDIATELY IMPLEMENT THE SOLAR HARVESTING BY MEANS OF APPROPRIATE SOLAR PHOTOVOLTAIC MODULES OF GREATER EFFICIENCY.
THE ALMIGHTY GOD THE UBIQUITIOUS OMNIPOTENT HAS PROVIDED US THE INEXHAUSTIBLE FORM OF ENERGY THROUGH THIS HELIOCENTRIC UNIVERSE WHILE, WE EVEN NOW DO NOT REALIZE THIS ENERGY GIFT BY GOD INSTEAD WE ARE ALWAYS ACT IN EXTRAVAGANT ENERGY UTILIZATION BY ALL CLASS OF PEOPLE THROUGHOUT THE WORLD.
IN WHATEVER POSITION-STATE, WE ALL ARE, WE ARE REALLY NEGLETING THIS ASPEFCT AND MOST PROBABLY WE ALL HAVE TO GREATLY THIRST FOR ENERGY OF ALL TYPES-WATER.
WHAT WE ALL SHOULD THINK OF IS THE COST ASPECT OF SOLAR PHOTOVOLTAICS IN ODER TO PROMOTE THIS AT A FASTER RATE.
AT ANY COST, HYBRID SYSTEM(WIND+SOLAR) AT APPROPRIATE GENERATION RATIO ACCORDING GEOGRAPHICAL STATUS OF THE EARTH SURFACE ALSO OF GREAT IMPORTANT TO BE THOUGHT AT THIS INSTANT.
MAY I SOLICIT YOUR VALUAABLE INFORMATION IN THIS REGARD SO AS TO ENABLE TO PROPAGATE THIS TO THE YOUNGER GENERATION IN A PHASED MANNER.
WITH WARM REGARDS AND GLITTERING X’MAS GREETINGS AND PROSPEROUS NEW YEAR 2K12 WISHES FROM THRISSUR THE CULTURAL CAPITAL OF KERALA, SOUTH INDIA.
C.A.JOHN(CHAZHOOR ANTONY JOHN)
[…] in 2030. We pulled this map from Treehugger but they ultimately attributed this graphic to the Land Art Generator Initiative. When I first think of the numer of solar panels needed to power the entire Earth I think of an […]
[…] that in Chapter 11 (Testing the Limits; Footprint of Solar Electricity;pg 209) our graphic on the surface area required to fuel the world with solar was adapted as Figure […]
[…] would be enough to cover the world's total energy consumption needs multiple times over (http://landartgenerator.org/…)Here is a very thoughtful, detailed, and peer-reviewed publication discussing land usage and […]
[…] Surface Area Required To Power The World (revision) Image by mkandlez My reworking of the brilliant Land Art Generator images ‘Suface Area Required To Power The World’ with one alternative energy source added Originals are here: landartgenerator.org/blagi/archives/127 […]
[…] You can read more here. This entry was posted in Energy and tagged solar power. Bookmark the permalink. ← Portland Bans the Plastic Bag […]
[…] to Power the World (with zero carbon emissions and with solar alone), assumptions and methodology here, it looks like a California of solar panels could more than power the […]
[…] De eerste kaart geeft een beeld van het oppervlak van de wereld dat nodig is om in onze totale energiebehoefte te voorzien door het benutten van zonne-energie. De tweede kaart laat per land zien hoeveel bos er aangeplant moet worden om de CO2 uitstoot te compenseren. Meer uitleg over de kaarten is hier te vinden. […]
[…] Originals are here: landartgenerator.org/blagi/archives/127 […]
[…] a report from the US Department of Energy, and you can double check all the math that went into it here. The author makes many interesting points, including that there are about 40,000 golf courses (each […]
[…] ‘In one second…’ ‘Vampire Energy’ and ‘How Much Fuel…’ courtesy of GOOD magazine. Surface Area…Solar’ and ‘Surface Area…Wind’ courtesy of Land Art Generator Initiative. […]
[…] consumption machinery or transportation. Absolutely incredible, right? I ran into this map by Land Art Generator while stumbling around the net. It reminded me of the ridiculous Verizon vs. AT&T coverage […]
[…] To put it into perspective an area the size of Spain located in the north of Australia covered in solar panels could produce enough power to supply the world with clean power. Source http://landartgenerator.org/blagi/archives/127 […]
[…] […]
[…] LandArtGenerator.org Share this post This entry was posted in Facts and Trivia and tagged commercial […]
[…] for you I did a quick google and this is what I found… (VERY VERY SIMILAR TO THE ARTICLE I HAVE) Land Art Generator Initiative Remember there are MULTIPLE sources to achieve energy. The right combination of wind, solar, […]
I think it would be really interesting to see a comparison map of the current area of the world that is being taken up with non-sustainable, carbon-emitting power plants and energy sources. I have no idea what the numbers would be for that, but it might be a nice contrast.
[…] machinery or transportation. Absolutely incredible, right? I ran into this map by Land Art Generator while stumbling around the net. It reminded me of the ridiculous Verizon vs. AT&T […]
[…] Total Surface Area Required to Fuel the World With Solar […]
[…] solar panels, heating, cooling, water purification, etc.? UPDATE: Found the postulation here:http://landartgenerator.org/blagi/archives/127 . Great comments – worth a perusal with a cup of solar […]
Er, don’t you have to use an equal-area map to get a meaningful result here? Looking at the hugely disproportionate size of Canada and Africa, this blatantly isn’t one.
Or is it deliberate, so that the solar panel placed close to the equator looks disproportionately small?
If you do an accurate version of this map using an appropriate projection, I look forward to linking to it!
Map projection is an equal area Mollweide projection: http://en.wikipedia.org/wiki/Mollweide_projection
In any case, the scale of the areas is founded on a three measure cross-check of the longest East-West measure of three continents: Australia, North America, and Africa.
Oops! Sorry to have wronged you, and thanks!
[…] The image is from a global map from the Land Generator Initiative whose calculations were based on the US Department of Energy’s figures of projected world consumption of energy in all of its forms (including traditionally consumed from generation via fossil fuels such as oil and coal.) as projected in 2030 – a staggering 199,721 terawatt hours. t’s a big area; however LGI says we could reduce that amount by 5% – 25% by adding in other renewable energy sources such as wind power, wave energy and existing hydroelectric. New hydroelectric facilities are not considered as an option as their establishment wreaks havoc upon the environment by flooding valleys and altering river flows downstream. By using concentrating solar power technologies, the amount of land required would be far less again and existing rooftop space utilised for solar power generation would further greatly reduce the amount of land set aside for such an initiative. Source: Land Generator Initiative […]
[…] square kilometers of forest is destroyed each year. If we constructed solar farms at the same rate, we would be done in 3 years. I don’t know about you, but I was expecting a lot more area, and when I first saw the […]
[…] […]
[…] energy projects get sited on disturbed lands like old mines and fallow agricultural lands. The LandArt Generator Project showed that you could generate more energy on the same footprint of all the existing coal mines […]
Hope your still answering posts! I was trying to investigate the answer to this question that I have heard before but wanted to be very clear before I go and advertise this…
Does the sun shine enough in 8 hours on America to power the world for 1 day?I know if that isnt right, it was somewhere around that. Just looking for a definite answer.
Thanks
Kyle
Using the US area of 9,629,091 square kilometers or 9,629,091,000,000 square meters:
.2KW per square meter of land x 9,629,091,000,000 square meters = 1,925,818,200,000KW peak capacity.
Assume that during the 8 hours, the efficiency of the entire system is only 25% due to weather conditions: 1,925,818,200,000KW x .25 = 481,454,550,000KW
Now multiply by the 8 hours (the above is the capacity and now we are multiplying to make KWh): 481,454,550,000KW x 8 hours = 3,851,636,400,000KWh
The world consumed about 140,000,000,000,000KWh in 2009. /365 days in a year = 384,000,000,000KWh per day.
In fact you have ten times more than enough. Or in other words, you could reduce all of your operating efficiencies by a factor of 10 and it still works out.
[…] Area Required to Fuel the World With Solar […]
As best I can tell, and as much as I’d like your area calculations to be correct, your calculations for the area needed to provide all energy via solar is way off.
First, the number you are using for solar input is an approximation of the solar constant (no problem here). However, this is based on the earth being a disc when the earth is actually a sphere. Thus, to account for angles of incidence and being on the wrong side, etc, the average solar input needs to be divided by 4 = 340w/m2.
Now this 340w/m2 is the solar energy incident at the top of the atmosphere. Only approximately half of this energy makes it to the surface of the earth.
Thus, just looking at your values for incoming solar energy, you have underestimated the area needed by a factor of 6. I haven’t looked at any of your other numbers at this point.
However, increasing the area by a factor of 6 still occupies only a small amount of the total land area. Have you done an estimate of the area of roof space and parking lot space in the US & Europe? This might be a good comparison figure so that we could evaluate just how much new land would need to be covered by panels vs using current structures to generate some of our energy needs.
In 2009, companies like Sunrgi (http://www.sunrgi.com/pv-efficiencty.html) are converting 375W per square meter of surface area with heliostatic XCPV fresnel lens systems. By the year 2030, I imagine that we will be able to go well beyond the 200W per square meter that I used in my calculation. In fact I was extremely conservative because I expected people to have the reaction that you had. If we apply the same rate of technological progress that has occurred to the microchip over the past 20 years, I think hitting 500W is something to aim for by 2030.
Thanks for your reply, but I guess I’m still stuck on if the incident solar energy at the earth’s surface is less than 200W/m2, it’s kind of difficult to get more than that.
Even the SUNRGI system (of which I was unaware and of which I still don’t fully understand) appears to only reduce the size of the panel at which light is converted — it still needs a large unobstructed area from which to gather light and focus it onto a smaller area. Just like a magnifying glass or mirrors, you can’t just calculate the area of the spot that you’ve focused light onto — you must include the area occupied by the glass or mirrors.
I’m not coming at this from complete ignorance nor hostility. I have solar PV and solar hot water and have spent some time in my past measuring photosynthetic rates in plants, etc.
Even following your link above for Incoming Solar Energy, it shows only about 50% of the incoming energy reaching the earth’s surface. I then followed up on this to get figures for the Earth’s energy balance which contrasts the solar constant that you have used to the average energy per square meter of earth’s atmosphere.
So, perhaps I’ve got this all wrong. I’d be happy to be wrong! And I have no doubt that technological improvements (like what we’ve seen with computing and cell phones) will result in unimaginable improvements in our ability to convert sun and wind into usable electricity.
Thanks again. Your graphics are great. But I’m not going to show these energy area visuals to my students until I have more confidence in where the numbers come from.
Rich,
The incident solar energy striking the earth’s surface is more than 200KW/m2. See this US Department of Energy white paper page 215: http://www.science.doe.gov/bes/reports/files/SEU_rpt.pdf. It references the research of Fletcher and Moen 1977 regarding direct solar insolation (DNI). Perhaps you are thinking about the reflected or radiated value (http://asd-www.larc.nasa.gov/erbe/). But that is what is reflected – not what strikes the surface. Every source I can find agrees with 800-1300w per m2 at between 40 and 0 degrees latitude. Or perhaps you are relying on an equation that averages the solar constant over the entire surface area of the globe which is not practically useful since we will never be placing collection devices above 60 degrees latitude. I’m relying on measured surface data from http://www.nrel.gov/.
Perhaps you may be convinced another way. Look at the graphic regarding solar incidence at http://re.jrc.ec.europa.eu/pvgis/countries/europe/EU-Glob_opta_presentation.png. This data is expressed not in KW/m2 but in KWh per year for optimally inclined south facing (not heliostatic) m2 surface. Depending on the latitude it ranges but let’s assume 2000kwh/m2/year. Now let’s say the efficiency of the system is 20% so that the output is 400kwh per year per m2. I’ve allotted a surface area of 496,804,500,000 in my study so that comes to 198,721,800,000,000Kwh. This is exactly the number we are expected to have to produce in 2030.
How about this graphic: http://en.wikipedia.org/wiki/File:Us_pv_annual_may2004.jpg. It figures the KWh per m2 per day which ranges from 5-8. Let’s use 6 as the value as it covers the entire southwest quarter of the USA. x 365 = 2190 Kwh per year. x 496,804,500,000m2 = 1,088,001,855,000,000. We’ve exceeded the amount required in 2030 by 889,280,055,000,000 KWh or 22%. Assuming that there is 22% complete cloud cover effect, we have it exactly right. Again this is assuming that we are not using tracking technology.
I hope this has convinced you. With these incident values of for example 6KWh/m2/day like on the second graphic it is easy to see that in a day with just 6 hours of direct sunlight the incident value is at 1000w per m2. If you were correct that the incident value was less than 200w/m2 then the KWh/m2/day number would never exceed 1.6-2.
Oh…I GET IT!
You are looking at: “Ignoring clouds, the average insolation for the Earth is approximately 250 watts per square meter (6 (kW·h/m2)/day), taking into account the lower radiation intensity in early morning and evening, and its near-absence at night.” on the Wikipedia entry for Insolation.
This is averaged over a 24 hour period! I’m using the actual 1000w per m2 hitting during the day and multiplying it times the expected hours of direct sunlight per year.
Aaah!
Thanks for taking so much time to figure out where our differences were — what a difference to be trying to compare global averages (as I was) to what you were doing (essentially practical application). That you were limiting the parts of the globe you were considering, and taking expected instantaneous inputs and multiplying by hours of max light was not obvious to me.
Thanks again for your efforts to educate me. I am, at least for a short while (!), reassured and confident in your numbers.
I am a fervent supporter of solar power, but I do not like getting caught using estimates that I can’t explain or justify. This all makes a lot more sense. Keep it up!
[…] Sowas lese ich mir gar nicht durch (ignorance ist bekanntlich bliss) sondern verweise lieber auf diesen schönen Artikel der vorrechnet, wieviel Fläche es braucht, um Solarstrom bzw. Strom aus Windkraft für die gesamte […]
[…] Landmass needed to power the globe with solar power.http://landartgenerator.org/blagi/archives/127 Landmass needed to power the globe with solar power.http://landartgenerator.org/blagi/archives/127 […]
There is surely the possibility of using the sea, lake, loch, harbour and river surfaces to host the solar panels?
A thought:
If you create a huge solar farm, you create a bunch of shade, which means any water you might leave laying around in that shade won’t evaporate as quickly.
That means you could possibly grow stuff in the shade of a solar farm and slowly reclaim desert areas (and gum up the solar panels)
Has anybody heard of such a strategy being studied?
Great idea! I’ve had similar thoughts about this. If the array is designed to allow 25% of the light through, it may well start to simulate a temperate ecology over time and function as a sort of green house especially if the space below is sealed and allowed to accumulate humidity.
But, if you’ve got solar panels covering the area, how does the water get to the ground? Also, you would have to make sure that the light that gets through are the red and blue wavelengths if you want plants to be able to grow — do we have solar cells that are this selective? And do we want to give up these wavelengths?
Why not focus solar generation on areas that are already built up and covered with impermeable structures? For example, houses, government buildings, parking garages, airport hangars, etc, which are also the places where electricity is needed. Adding in wind, etc, we will then greatly reduce the areas of currently undisturbed land that we would need to cover (areas that are often far from where the electricity demand is which means we have to factor in energy losses for transporting to markets via wires).
Not either or, but both and. Use all of the area of existing unused impermeable surfaces. You will perhaps still require arrays in the landscape. If these are heliostatic which they should be to maximize efficiencies, then during the day, they will move and allow reflected and ambient light sufficient to use the “understory” for some agricultural purposes, especially if they are place apart and at a sufficient elevation. In a desert area, a proper design could have the added benefit of reclaiming moisture to the soil.
[…] How much of the earth would you have to cover with solar panels to power the entire p How much of the earth would you have to cover with solar panels to power the entire planet? Land Art Generator Initiative […]
[…] It will be in our lifetime that energy is no longer a cost nor an environmental issue. It will bring about changes that we cannot imagine; because the cost per watt, with Moore’s law in mind, all things considered will go towards zero, since the sun is an eternal energy source (OK the sun explodes in about 5 million years and becomes a giant red star, but hey, don’t worry). The energy density of the suns rays are so powerful that with existing technology today, the efficiency is min. 20% of incoming energy to electric energy in solar panels. If the Sahara desert was converted to one big solar power plant, it would be capable of powering the worlds TOTAL energy consumption 18 times (barrels of petroleum, cubic meters of natural gas, watts of hydro power, etc.). […]
I love this!
[…] http://landartgenerator.org/blagi/archives/127 […]
[…] se puede ver la imagen en grande. Y aquí, el proceso de cálculo que se ha seguido. Vía Information Is Beautiful. compartir es […]
i don’t understand why environmentalists get so upset about putting solar panels in certain locations when it would save many other environments from destruction by pollution and possibly prevent the extinction of certain species from climate change due to excessive emissions of several “greenhouse” gasses. i believe it would be much better than relying on combustion for out energy needs. The bio diesel is a good idea except for the fact that it still emits harmful gasses. The solution will be a combination of energy resources, but i don’t think any type of burning, other than hydrogen, should be part of it.
Fuel of the future could be found in a fuel from the past!
Early cars were duel fuel, and could run on petrol or alcohol. Due to the energy used to distil beer or wine into 85% alcohol or more for fuel, it was cheaper to buy oil-based fuel, despite these burning with more impurities than alcohol does.
(Alcohol is already part oxidized, so produces less btu of energy when burned. The extra oxygen released however makes it less likely that carbon released will form poisonous carbon monoxide. Also, as alcohol mixes with water, in a combustion engine the steam produced makes a boost of pressure against the pistons, which compensates for lower btu. This has been used for years in indy car racing with run on methanol)
Brazil has excess sugar cane to ferment, and has now been running many of its vehicles on ethanol for years. Buses, cars, even planes!
So! My point is. Why build solar panels to catch the suns energy, when all plant life on earth has evolved to do just that?
All green plants on earth are on average 33% cellulose. Cellulose is a polymer of sugar. To humans, it is indigestible fibre, but many forms of life produce the enzymes that break it down into fermentable sugars.
if you google for “cellulosic ethanol”, you’ll find that NREL researchers in Colorado are working on improving the efficiency of the process. Improvements in the Methods of seperation, production of enzymes, or yields of yeasts could make fueling the world from waste plants a viable option.
[…] You can read more about it here. […]
We could put it in the New Mexico salt mines! The mines contain what remains of the Cold War and are thousands of feet underground.
This picture is amazing. If we create solar plants of this size, image how the view from space will change in the coming years. One other idea that is in development is generating electricity via satellite in space. The energy is transferred to earth through electronic waves and converted back into electricity. In space, we can generate electricity night or day and do not have to worry about the environmentalists.
space is an environment, too.. everything everywhere impacts everything everywhere. any exceptions you can think of?
[…] http://landartgenerator.org/blagi/archives/127 « Diugoń […]
[…] Muito legal. Confira. […]
Although the calculation is stunning when visualized like that, solar power does not produce energy in a particularly convenient form. Batteries are inefficient, heavy, and expensive. The current infrastructure is built upon an energy in liquid form. This is why the idea of biofuels is so attractive since it could potentially convert sunlight to a diesel form with high efficiency.
are you sure about that? sounds like batteries and ultracapacitors have huge momentum currently and will be produced with long life cycles and at low costs when you read these:
http://www.technologyreview.com/article/23197/page1/
http://solar.coolerplanet.com/News/8070901-ceramatec-develops-24-hour-solar-energy-storage-battery.aspx
http://www.greentechmedia.com/articles/read/grid-storage-batteries-and-ultracaps-an-8.3b-market-by-2016/
And let’s not forget hydrogen batteries…
Where are all of these solar panels going to come from? What is the environmental cost of creating all of these solar panels and the other infrastructure needed to create these solar farms? How are you going to get the panels and the other infrastructure to the sites? Where are you going to find 1000 10km square sites in the US to build these farms that won’t be objected to by environmentalist based on the environmental impact?
[…] (pic: klick > grösser) ( via landartgenerator) […]
[…] LINK Tagged with: Carbon Emissions, Energy, Fuel, Power, Solar Panels, Wind Power leave a comment « Run, Izzard, run and run again […]
[…] Link – via coolinfographics […]
[…] Link – via coolinfographics […]
[…] Link – via coolinfographics […]
[…] 678 quadrillion Btu by 2030 – a 44% increase over 2008 levels. That’s a lot of energy. Saw this really interesting article that tries to project the total surface area required to fuel that 2030 world with ONLY SOLAR […]
[…] http://landartgenerator.org/blagi/archives/127 Leave a Comment No Comments Yet so far Leave a comment RSS feed for comments on this post. TrackBack URI Leave a comment Click here to cancel reply. Line and paragraph breaks automatic, e-mail address never displayed, HTML allowed: <a href="" title=""> <abbr title=""> <acronym title=""> <b> <blockquote cite=""> <cite> <code> <pre> <del datetime=""> <em> <i> <q cite=""> <strike> <strong> […]
[…] to the United Nations 170,000 square kilometres of forest is destroyed each year. If we constructed solar farms at the […]
[…] [Update: 9/13/09 – Infographic Source: The Land Art Generator Initiative] […]
Total Money Required to Power the World with Solar Energy Alone…
In this article I estimated what would be the cost to power the world using exclusively solar power and compare it to the Gross World Product and the total yearly combined consumption of fossil fuels.
……
[…] escribe Land and Art generador, autor de dicho estudio: “Según las Naciones Unidas cada año se destruyen 170.000 km2 de […]
[…] Here are graphics for wind based and solar on landartgenerator calculations. […]
[…] on the Information is Beautiful blog. If you’re curious, you can read more about the science here. SOURCE: […]
>…
[ ] …Still going strong. I am very pleased with the summer power output of these panels. I wash them with a hose 1x/mo to keep the output current up. Measured before washing and after washing the panel efficiency is clearly a factor of how much dirt …
[…] Per conoscere numeri precisi e formule calcolate dai promotori del progetto per produrre l’energia sufficiente al mondo, soltanto con i pannelli solari, potete approfondire qui su Landartgenerator. […]
[…] according to Land Art Generator Initiative, the website that created that beauty of an image, “According to the United Nations 170,000 […]
Beautiful graphics, too bad governments and policy makers will never hear you over the deafening screams of the ‘average voter’ 🙁
You see a number like 500,000(~) square kilometres and think it’s a big area? Sure it is, but no where near as big as you think. It’s a single rectangle 500Km long by 1000Km wide. That’s insignificant, in my opinion, for indefinitely producing enough clean electricity to supply the world’s needs for at least the next quarter of a century.
[…] Land Art Generator Initiative han realizado una representación sobre qué superficies se necesitarían para suplir las […]
[…] From LandArtGenerator.org. Image here. Science here. […]
I love to see map-based information, a picture is worth a thousand words, as they say.
My coverage of this post is at http://www.nonscalable.com/?861843287
I’m so glad I found this site…Keep up the good work
[…] Energiebedarf zu decken. Heute (blau) und 2030 (grün). Dazu gibt es eine umfassende Erläuterung: Total Surface Area Required to Fuel the World With Solar Social Bookmarks Strom | Trackback | RSS […]
[…] Art Generator Initiative has a similar graphic on offshore wind and lots more information on their […]
[…] http://landartgenerator.org/blagi/archives/127 a few seconds ago from web […]
[…] el post original se explica cómo se hizo para calcular el área que se necesitaría. Es muy interesante darle una […]
[…] el post original se explica cómo se hizo para calcular el área que se necesitaría. Es muy interesante darle una […]
Cool site, love the info.
[…] In case you haven’t seen this, check it out: […]
[…] Para más información ir a la página de Land Art Generator Initiative. […]
[…] been making the rounds of the internet lately (sadly it hasn’t always been attributed to the Land Art Generator Initiative). It’s a bit similar to things we posted about <a […]
[…] an interesting map from the Land Art Generator Initiative that shows the land surface area per region that would be required to power the world with solar […]
[…] Land and Art generador hizo un estudio y se reveló cuántos paneles solares se necesitarían en el año 2030 para poder […]
[…] been making the rounds of the internet lately (sadly it hasn’t always been attributed to the Land Art Generator Initiative). It’s a bit similar to things we posted about <a […]
How do you figure 20% efficiency?
As far as I know, 20% is how much of the total “captured” solar energy that is converted to electricity in most modern photovoltaic cells. How much of the total energy striking the device is actually “captured”? It can’t be 100% — think of all the energy lost to cell casing (those things aren’t all built the same way), transmission (are they copper wires or what?), and heat (those things get hot).
Anyway, great project, and I’m glad it’s getting so much attention. Just curious about how accurate the estimates are based on the current state of solar technology.
I figured 200w of the 1000w per square meter that strike the panels. Some PV cells have been manufactured to over 40% efficiency so by 2030 we should have a good handle on transmitting a solid 20%.
[…] been making the rounds of the internet lately (sadly it hasn’t always been attributed to the Land Art Generator Initiative). It’s a bit similar to things we posted about <a […]
[…] been making the rounds of the internet lately (sadly it hasn’t always been attributed to the Land Art Generator Initiative). It’s a bit similar to things we posted about <a […]
[…] been making the rounds of the internet lately (sadly it hasn’t always been attributed to the Land Art Generator Initiative). It’s a bit similar to things we posted about <a […]
I’m the guy who submitted that image on digg, I found it on another image site. I’m a novice at this SEO linking thing and also digg.
But I did give the link in the fifth comment and that too when it had only 30 diggs. Iam extremely sorry about this and learnt a true lesson.
[…] Power the World With Solar or Wind Published September 3, 2009 Environment / Sustainability , Technology Leave a Comment Interesting study into how much solar and wind coverage we need to fulfill the worlds needs….assuming theres money to pay for all of this. Posting from fastcompany.com and landartgenerator.org […]
What about getting the power to the end user? How much energy loss do to resistance?
If localized and transmitted over HVDC lines it should be within the margin of error for the percentage efficiency of the panels themselves. Like I mentioned below, I figured 20% but there are PV panels that can capture 40%. By 2030, we should have mass production on fairly efficient cells and the transmission losses may end up bringing the gross capacity back down to around 20% of the 1000w per meter that strike the earth’s surface. Since we don’t know how far the power is traveling (the sites are only representational), it is impossible to figure the actual voltage drop over transmission lines.
[…] map was created by the Land Art Generator Initiative to show the amount of solar panel coverage required to power the Earth for one year. Very […]
[…] la forma de generación de energía que actualmente estamos utilizando. Por ese motivo desde Land and Art generador se hizo un estudio y se reveló cuántos paneles solares se necesitarían en el año 2030 para […]
[…] 44 por ciento superiores a las actuales, se necesitaría cubrir medio mundo con placas. Pero no, en Land and Art Generator se pusieron a hacer cuentas de la superficie total del planeta cubierta de placas que se […]
[…] This post was Twitted by paulobafonseca […]
[…] la forma de generación de energía que actualmente estamos utilizando. Por ese motivo desde Land and Art generador se hizo un estudio y se reveló cuántos paneles solares se necesitarían en el año 2030 para […]
[…] la forma de generación de energía que actualmente estamos utilizando. Por ese motivo desde Land and Art generador se hizo un estudio y se reveló cuántos paneles solares se necesitarían en el año 2030 para […]
[…] http://landartgenerator.org/blagi/archives/127 a few seconds ago from web […]
[…] http://landartgenerator.org/blagi/archives/127 a few seconds ago from Twhirl […]
[…] http://landartgenerator.org/blagi/archives/127 a few seconds ago from Twhirl […]
[…] power alone. I won’t get into the math behind the map, since you can find the calculations here. The analysis concludes that in 2030, we will need 496,905 square kilometers to power the world […]
[…] came across this interesting map today: (Click here for the original post) Now, I have minor gripes with the assumptions made by the author, foremost of which is […]
[…] to the Land Art Generator Initiative, this is the amount of surface area required to power the world with solar panels. […]
[…] Original Source Here […]
Thanks for sourcing it out and posting back here you guys.
Travis is right…
Man, you guys HAVE to be kicking yourselves that the stories on digg and reddit were both links to an image site, with absolutely no credit to your site.
Seriously, for PR materials like this, how can you overlook a “landartgenerator.org” watermark in the corner??
[…] Total Surface Area Required to Fuel the World With Solar (tags: solar energy) […]
This is so hopeful – I hope those in power read this and get a move on.
Intelligent (well, for the most part…) discussion on the feasibility of solar as you illustrated on Reddit –
http://www.reddit.com/r/science/comments/9fjdy/surface_area_required_to_power_the_whole_world_by/
[…] Incredible by Ilse de Lange en so incredible by Land Art Generator Initiative. […]
This provides an alternate view on nuclear power, which I hope you’ll find interesting.
http://www.sustainablenuclear.org/PADs/pad11983cohen.pdf
Your image was digged
http://digg.com/environment/Surface_Area_Required_to_Power_the_World_From_Solar_Panels
[…] This post was Twitted by actforclimate […]
[…] Información completa en: Land Art Generator Initiative – Total Surface Area Required to Fuel the World With Solar […]