
click on the image above to access the full-size PDF
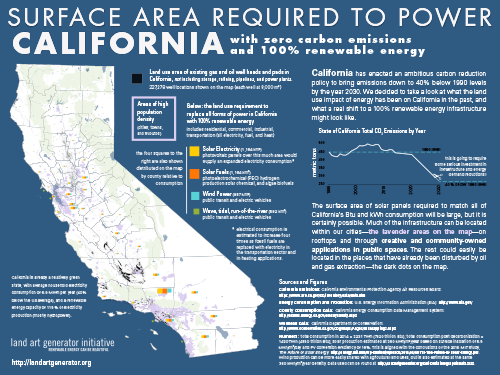
California has enacted an ambitious carbon reduction policy to bring emissions down to 40% below 1990 levels by the year 2030. We decided to take a look at what the land use impact of energy has been on California in the past, and what a real shift to a 100% renewable energy infrastructure might look like.
The information graphic is the latest in our series that explores the land use impact of renewable energy in a post-carbon world. Starting in 2009 with the Surface Area Required to Power the World with Solar, we have been making the case that the renewable energy transition, while a huge undertaking, is not any more ambitious in scale than previous human endeavors, and that the footprint on our environment can be designed to be in harmony with nature and provide a unique benefit to human culture.
In this graphic, we show a diversified mix of renewable energy technologies and the impact in terms of land area in direct proportion to consumption by county (you can quickly see that Los Angeles County is the biggest consumer). Much of the infrastructure can be located within our cities—on rooftops and through creative and community-owned applications in public spaces. The rest could easily be located in the places that have already been disturbed by oil and gas extraction—the dark dots on the map.
By enlisting these fossil fuel land areas in the fight against climate change, we can keep the CO2 the ground while we clean up the sky.
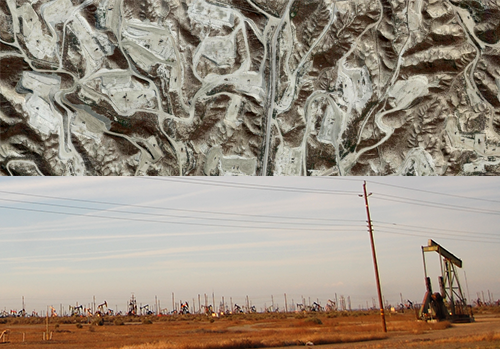 This is what all of the 227,278 dark dots on the map look like up close (near Bakersfield, CA)
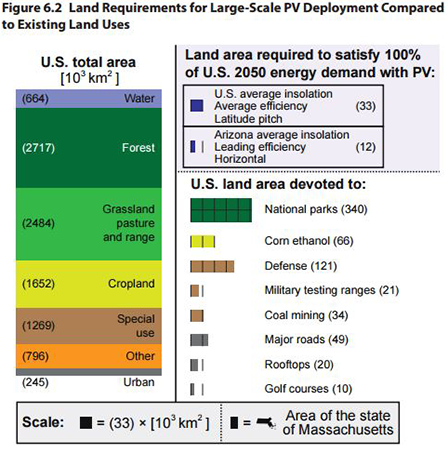
In the course of our research, we came across the MIT study, The Future of Solar Energy, which also includes a section that studies land use comparisons. We were fascinated to learn that across the entire US, the land area required to satisfy 100% of U.S. 2050 energy demand with PV would be no larger than the surface area that has already been “disturbed by surface mining for coal.” Some other comparisons from the study:
The land area required to supply 100% of projected U.S. electricity demand in 2050 with PV installations is roughly half the area of cropland currently devoted to growing corn for ethanol production, an important consideration given the neutral or negative energy payback of corn ethanol and other complications associated with this fuel source. That same land area&emdash;i.e., 33,000 km2 to supply 100% of U.S. electricity demand with PV&emdash;is less than the land area occupied by major roads. The currently existing rooftop area within the United States provides enough surface area to supply roughly 60% of the nation’s projected 2050 electricity needs with PV
Diagram from The Future of Solar Energy, Chapter 6: PV Scaling and Materials Use
California is acting on a plan (read more about the Governor’s Climate Change Pillars: 2030 Greenhouse Gas Reduction Goals) that should set the standard for the entire country. By reaching 50% renewable electricity production, reducing petroleum use in transportation by 50%, and increasing energy use efficiency, these 2030 goals can provide the momentum for a 100% renewable energy economy by 2050.
Recognizing the unprecedented global threat of human induced climate change, we do not have the luxury of acting any less vigorously than California on a global scale, and in fact, that may not even be fast enough. Don’t ask how much it will cost because that is the wrong question. What will be the cost to the children born in 2016 if we do not act now? The technology exists to begin today, and the economic stimulus effect of a WPA-scale regenerative infrastructure project for the 21st century will bestow positive benefits for generations.
Let’s get to work!