
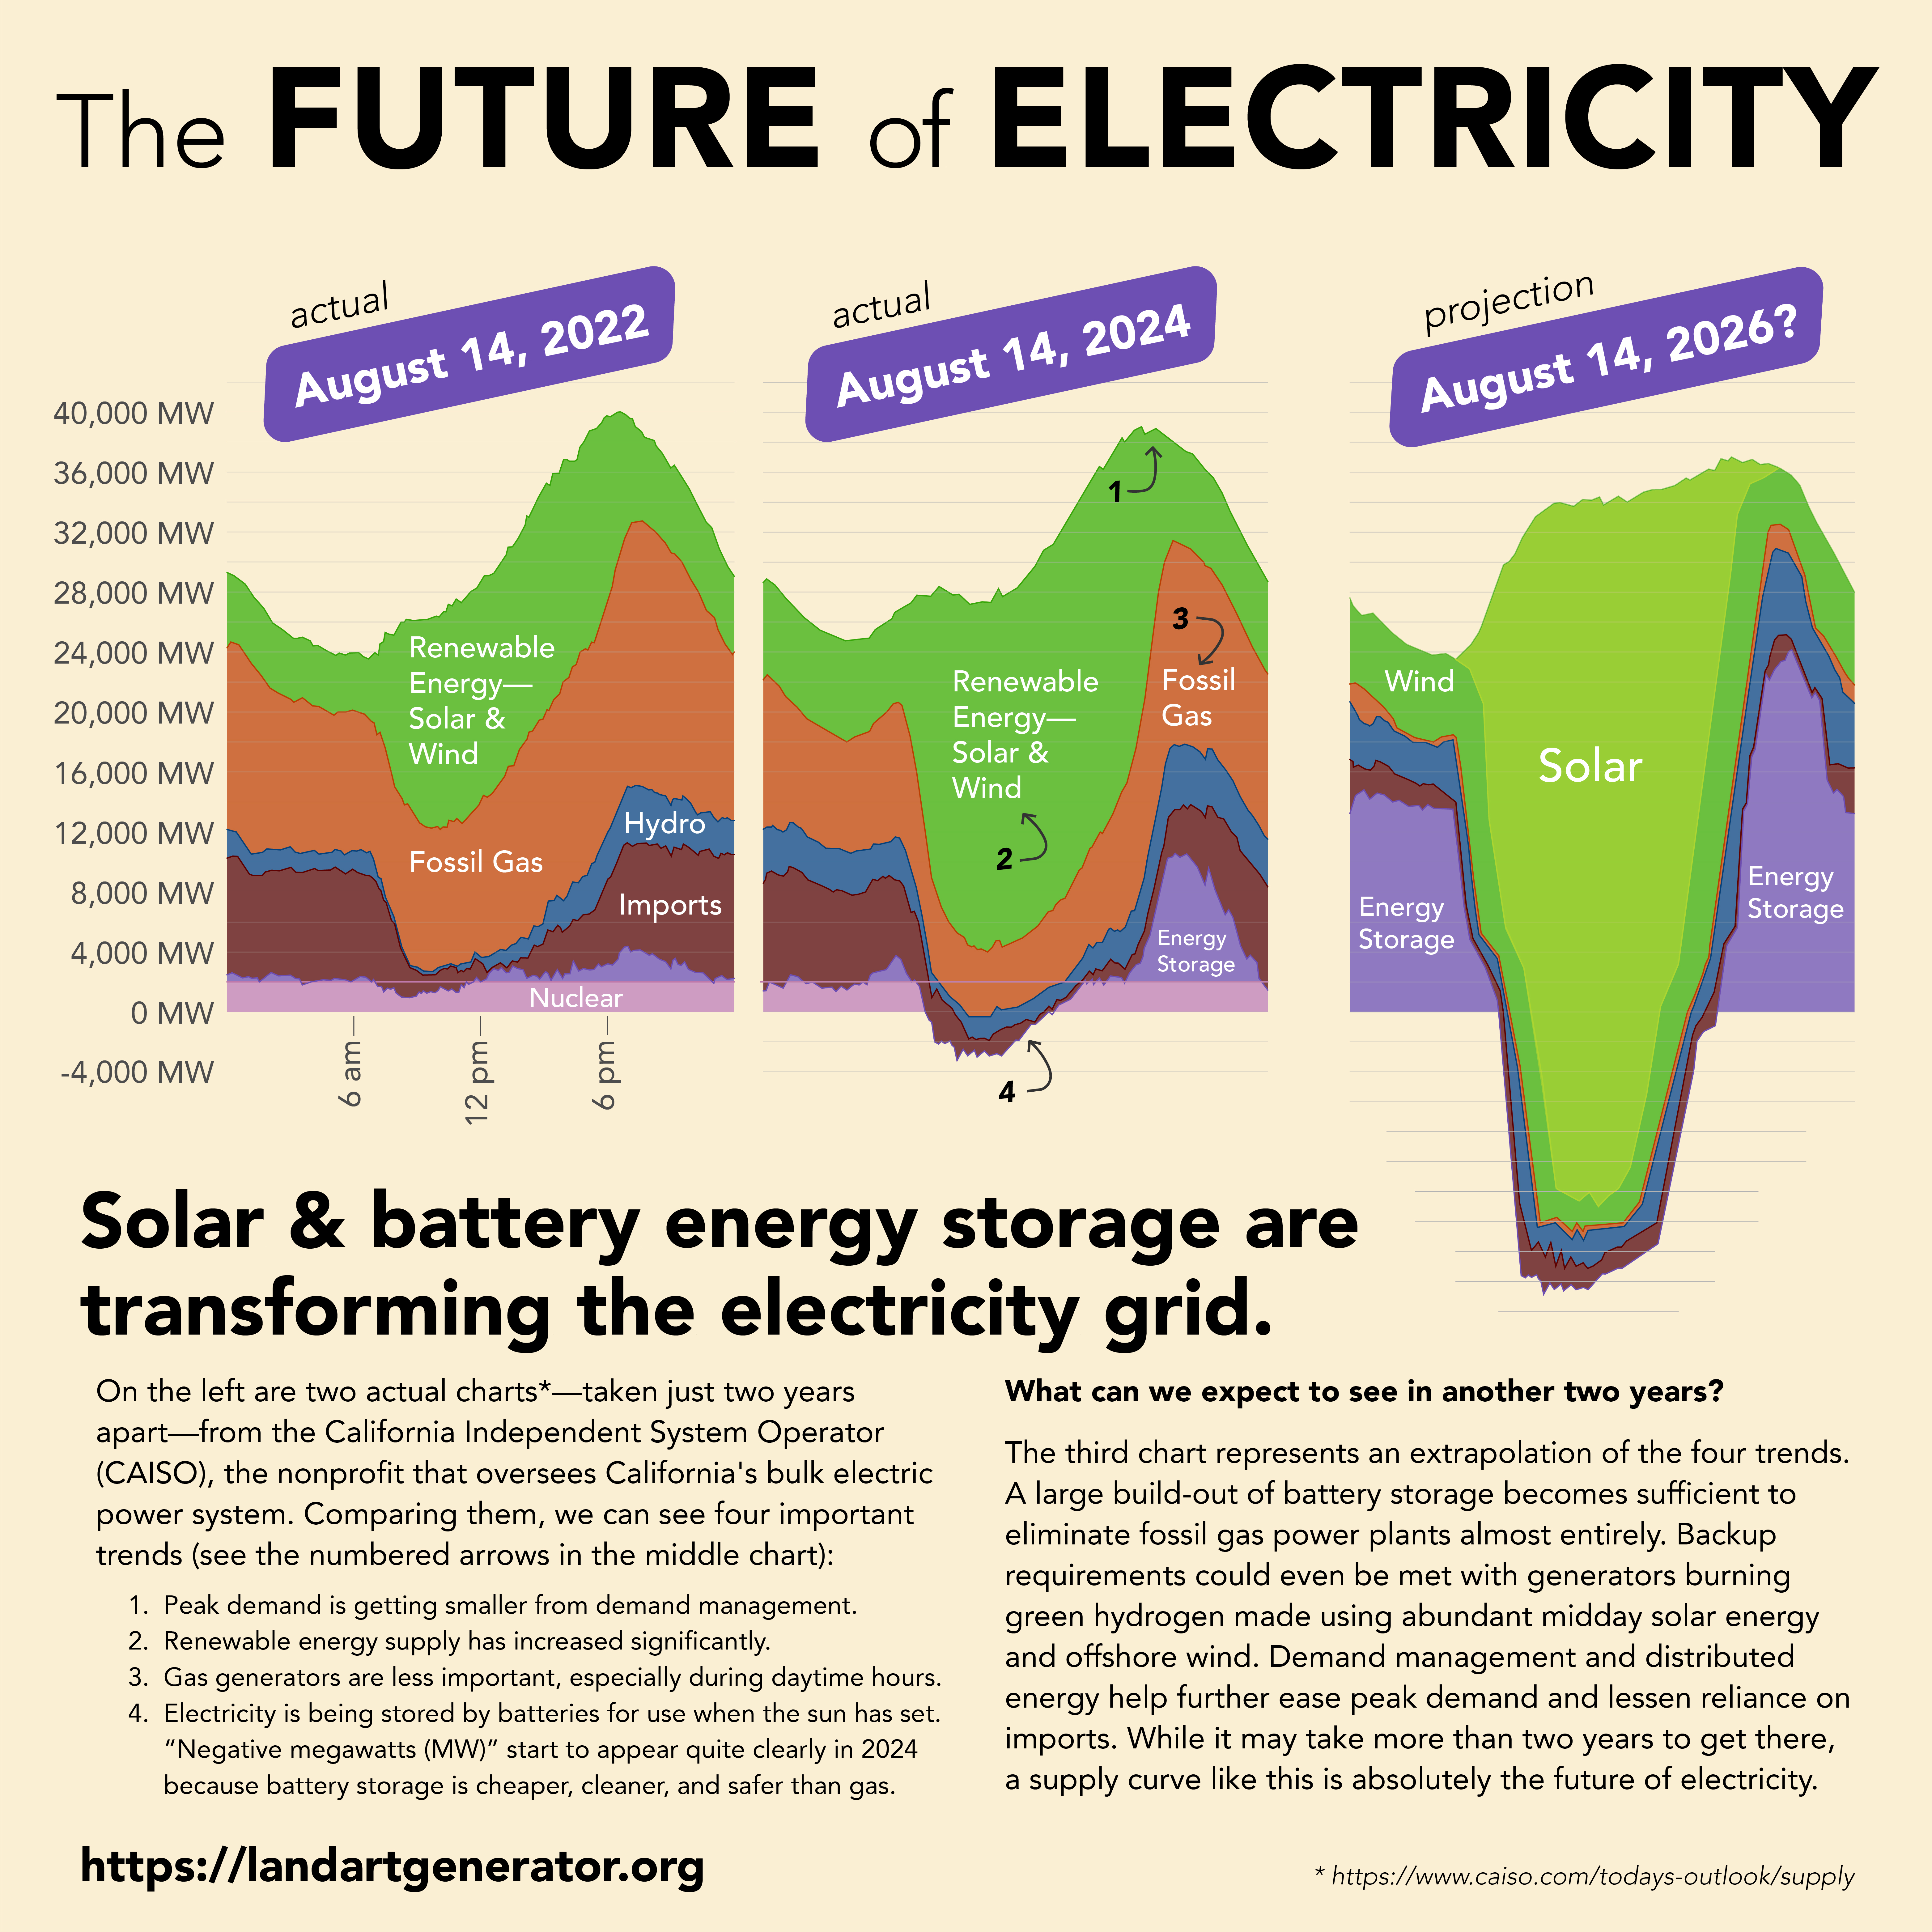
On the left is the way California supplied power in 2022. By 2024 (middle chart) we can start to see the impact of more solar and battery storage on the grid. Carry this trend forward to see the future of electricity. Data from www.caiso.com.
Click the image for a high-resolution version.
Since the advent of solar, wind, and other renewable energy technologies there have been concerns about how they might impact the overall electricity grid. As the tired saying goes, “the sun doesn’t always shine and the wind doesn’t always blow.” The term of art for this is variability (or intermittency), meaning that solar and wind technologies are not capable on their own of providing the firm and reliable power that can meet the demands of the grid.
The problem of variability started to become more of a concern in the 2010s as solar power deployment began to ramp up sharply. People started talking about the “duck curve” or the mismatch between peak demand and the output of solar power. Just as the sun is setting in the late afternoon, electricity demand tends to spike. Without some solution to this variability problem, solar and wind energy risk being curtailed (shut off and wasted) during the day and we would need to continue relying on fossil fuel powered electricity, especially in the evening and overnight.
There are a number of ways to address variability. Solar and wind can be complementary. The wind is often strongest at night when solar panels are dormant, and wind resources sometimes drop midday when solar panels are most productive. Therefore a mix of solar and wind can help, but that can only get us so far.
Long distance transmission can also help by sending excess electricity from windy and sunny locations to calm and cloudy ones. But building out a vast high voltage transmission network is costly and time consuming.
Clean firm renewable energy technologies like geothermal, tidal, or wave energy can help too, but they currently make up a very small percentage of generation resources. Hydropower can assist by timing the release of water from reservoirs or even by pumping water uphill when the output of solar and wind energy is strong. The impact of these “gravity batteries” is limited by the availability of existing dammed hydro facilities and for environmental reasons it is not a good idea to build more of them.
This leads us to the real and lasting solution to the variability challenge that is already on its way to making a real impact: battery energy storage systems (BESS).
The duck curve term was coined in 2012 by the California Independent System Operator (CAISO), the nonprofit that oversees California’s bulk electric power system. At that time, they were ahead of much of the world on the percentage of utility solar resources on the grid and as a consequence they were seeing the early signs of a potential variability issue. Once again in the 2020s California is seeing early signs of change, and this time the news is very good.
On the left is the way California supplied power in 2022. By 2024 (middle chart) we can start to really see the impact of more solar and battery storage on the grid. Carrying this trend forward we can see the future in the chart on the right.
These four trends are irreversible:
- Peak demand is getting smaller from demand management.
- Renewable energy supply is increasing rapidly.
- Gas-fired power plants are becoming obsolete.
- Large-scale battery storage of solar and wind power is cheaper, cleaner, and safer than using gas power plants.
What can we expect to see in another two years?
The third chart represents an extrapolation of the four trends. A large build-out of battery storage becomes sufficient to mostly eliminate fossil gas power plants. Backup requirements could even be met with generators burning green hydrogen made using abundant midday solar energy and offshore wind. Demand management and distributed energy help further ease peak demand and lessen reliance on imports. As we tackle the daily variability cycle with battery storage and additional clean firm deployment we will also begin to solve the seasonal variability with long-duration energy storage.
While it may take more than two years to get there, a supply curve something like this is absolutely the future of electricity, first for California and then for the rest of the world.