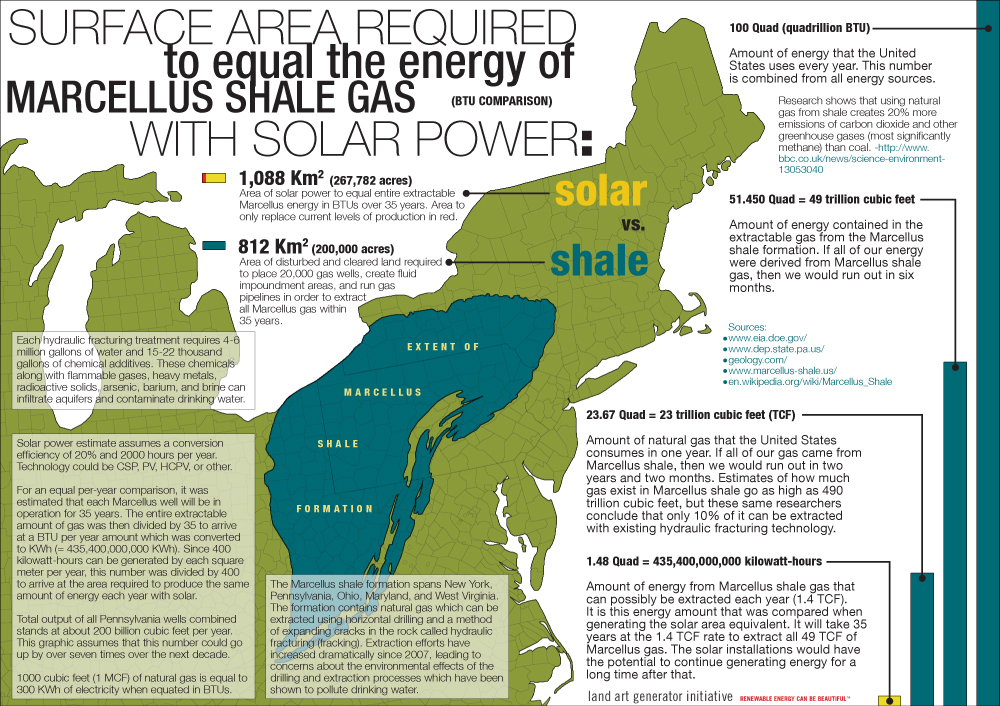
The latest in our information graphic series is a study of how much surface area would be required to replace all of the BTUs of energy that can possibly be extracted from the Marcellus shale formation in the United States. The drilling activity has been very controversial due to the large amount of water consumed and the detrimental effects on the environment, most notably water aquifers and watersheds, created from the horizontal drilling and hydraulic fracturing (fracking) methods that are required to make Marcellus shale gas extraction a viable prospect.
 More information about Marcellus shale and the environmental effects of fracking can be read here, here, and here.
A blowout two days ago at a well in Canton, Pennsylvania spilled thousands of gallons of chemical-laced water into a nearby stream. Events like this occur many times each year.
A map of sites with Department of Environmental Protection violations shows that safety oversights are extremely common. Even in wells that meet regulations there is often significant leeching of hydraulic fracturing fluids into the ground by nature of the process.
 4-6 million gallons of water and 15-22 thousand gallons of chemicals (here’s a PDF list) are injected into the ground during a typical fracking treatment (the process opens up cracks in the rock formations to allow the gas to escape). About 40-50% of this fluid is pumped back to the surface, containing the original chemicals and also with heavy metals, radioactive solids, arsenic, barium, and brine that is brought up from the rock. On the surface, it is held in fluid impoundment areas and then carried to treatment facilities by truck or injected back into the earth. The fluid that is re-injected can contaminate groundwater, and if it is instead hauled off-site, wastewater treatment facilities typically are unable to remove salts and other dissolved solids in brines.
 One of the reasons often used to make the case for the expanded extraction of difficult to reach natural gas deposits is that natural gas is cleaner burning than coal or petroleum. A recent study from Cornell University shows that, in fact, the extraction of gas from sources like the Marcellus shale can lead to even greater amounts of greenhouse gas emissions than normally occur from the mining and use of coal.
The graphic at the top creates a comparison between the energy (measured in BTUs) that can be extracted from the Marcellus shale formation gas deposits and how much surface area of solar installations would be required to equal the same amount of energy generation capacity.
 Interestingly, the area that is required to be cleared for drilling and piping operations is nearly equal to the area required for the same amount of solar energy generation capacity. We have assumed that 20 acres of land is disturbed per well. We have also assumed that each well can produce 0.005 trillion cubic feet (TCF) of gas over its lifetime of 35 years. This will require 10,000 wells working for 35 years to exhaust the 50 TCF of gas that it has been estimated can be extracted with present technology. 10,000 wells would produce 1.4 TCF per year (current production rate is 0.2 TCF per year), which is equivalent to 435,400,000,000 kilowatt-hours. It is this number that was used to estimate the surface area required, approximating 400 KWh per square meter per year.
Here is an interesting assessment from Business Insider of the potential exaggeration of Marcellus shale gas reserves and their potential for useful and profitable extraction. The article points the the fact that most companies can only be profitable at $7.00/MCF wellhead price. At current wellhead prices (about $4.50 per MCF) the potential net sale of all extractable gas (50 TCF) is $225 billion.
 But the cost of extraction is not cheap. It can cost $6.5 million to get a well to the point of sustained production. With a lifetime production capacity of about 4,400,000 MCF, each well stands to net $20 million but that is over the entire lifetime of the well, which could be 30-40 years. The operational costs of keeping the well in production over that time eat into that $13.5 million potential profit. So, along with wellhead price, the assumptions of what the falloff rates are become key to the equation.
During the first year (immediately after hydraulic fracturing) a typical well could bring up 1,000MCF-1,500MCF per day. But the very next year, that will fall by more than half and it will fall each year over the next ten to a point at which it will be producing less than 100MCF per day, and only 50MCF after 20 years. When a well falls below 50MCF per day, it can barely offset the cost of the compression energy required to extract the gas. Re-fracking could potentially squeeze some more out, but at what cost?
Given all of the potential downside risks to this type of energy production, it just doesn’t seem to make sense, certainly in the long term. But companies often enter into such speculation bubbles because they can make money off of investors and friendly legislative policies over the course of a decade and get out before the industry collapses. In order for a market to function properly and make good macro-decisions, it needs to be aware of all of the facts: realistic proved reserves and externalized costs to infrastructure and the environment.
Complete list of sources for this graphic:
http://geology.com/usgs/marcellus-shale/
http://geology.com/articles/marcellus-shale.shtml
http://waytogoto.com/wiki/index.php/Range_Resources
http://www.eia.doe.gov/oog/info/ngw/ngupdate.asp
http://www.eia.doe.gov/dnav/ng/ng_pri_sum_a_EPG0_FWA_DMcf_m.htm
http://www.eia.doe.gov/dnav/ng/ng_cons_sum_dcu_nus_a.htm
http://www.marcellus-shale.us/
http://marcellusdrilling.com/
http://www.dep.state.pa.us/
http://shale.typepad.com/marcellusshale/operated-wells/
http://marcellusearthfirst.rocus.org/?q=node/3
http://en.wikipedia.org/wiki/Marcellus_Formation
http://www.bizjournals.com/buffalo/stories/2008/02/11/story2.html?b=1202706000%255E1587557
http://www.businessinsider.com/marcellus-shale-disappointment-2010-10
Related Posts
1 Comment
Add comment Cancel reply
This site uses Akismet to reduce spam. Learn how your comment data is processed.


[…] like to see more direct comparisons in relation to the land use implications of solar vs coal or fossil gas, you can find them in our information graphics […]