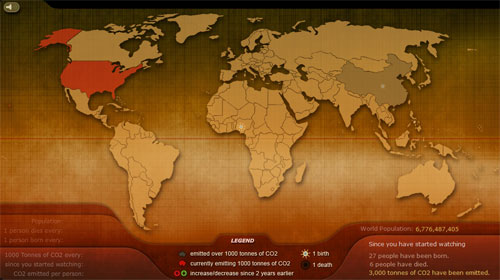
As I was browsing around all of the links that we have now set up here, I stumbled across this gem on the infranetlab site:

click on the image to visit the site
It is based on statistics for birth and death rates along with CO2 emissions for every country in the world. Based on those statistics the flash file shows a real-time simulation of what is happening in the world. As you watch, people are born, people die, carbon is emitted into the atmosphere. I’ve never before seen anything that makes it clearer the direction that our planet is headed in. While I watched for about 10 minutes, more than twice as many people were born as passed away. The population of the planet went up by almost 3000 people net (subtracting those that died from those that were born). At the same time, nearly 700,000 tonnes of CO2 was released into the atmosphere by the burning of fossil fuels.
It is fascinating to note the extreme disparity of CO2 emissions per capita when comparing the highly industrialized countries to the less “advanced” nations. Simply roll your mouse over the US (19.66 tonnes per person per year) and then slide on down to Bolivia (0.75 tonnes per person per year).
When the file first loads, all countries are light brown. But as the first seconds tick by, the USA and China are the first to glow red then remain grey which means that they have emitted 1000 tonnes of CO2. Next to glow red is Russia followed closely by India and then Japan. You’d have to watch for 4 hours before every country in the world reached their first 1,000 tonnes emission point.
