Technology
Information Graphics
LAGI Projects
Inspiring Artworks
LAGI Publications
HOME
About
Leadership
Background
Founding Story
Bring Land Art Generator to Your City
Open Letter to the UNFCCC
Competitions
LAGI 2025 Fiji
LAGI 2022 Mannheim
LAGI 2020 Fly Ranch
LAGI 2019 Abu Dhabi
LAGI 2018 Melbourne
LAGI 2016 Santa Monica
LAGI 2014 Copenhagen
LAGI 2012 New York City
LAGI 2010 Dubai & Abu Dhabi
About the LAGI Competitions
Projects
LAGI Glasgow
LAGI Willimantic
Maasai Solar
WindNest
Art & Energy Camp
Solar Mural Artworks
Education
Outreach
Art & Energy Flash Cards
Infographics
Field Guide to Renewable Energy Technologies
STEAM Workshops
Idea Generator Game
2015–2016 Youth Prize
Portfolio
LAGI 2010 Dubai/Abu Dhabi
LAGI 2012 New York City
LAGI 2014 Copenhagen
LAGI 2016 Santa Monica
LAGI 2018 Melbourne
LAGI 2019 Abu Dhabi
LAGI 2020 Fly Ranch
LAGI 2022 Mannheim
LAGI 2025 Fiji
Books
News
Blog
Contact
DONATE
Search
Technology
Information Graphics
LAGI Projects
Inspiring Artworks
LAGI Publications
infographics
March 14, 2012
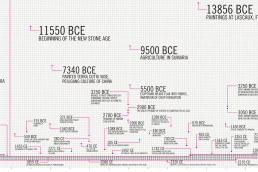
The Era of Fossil Fuels
by landartgenerator
Privacy Preference Center
Privacy Preferences